Fig. A.4.
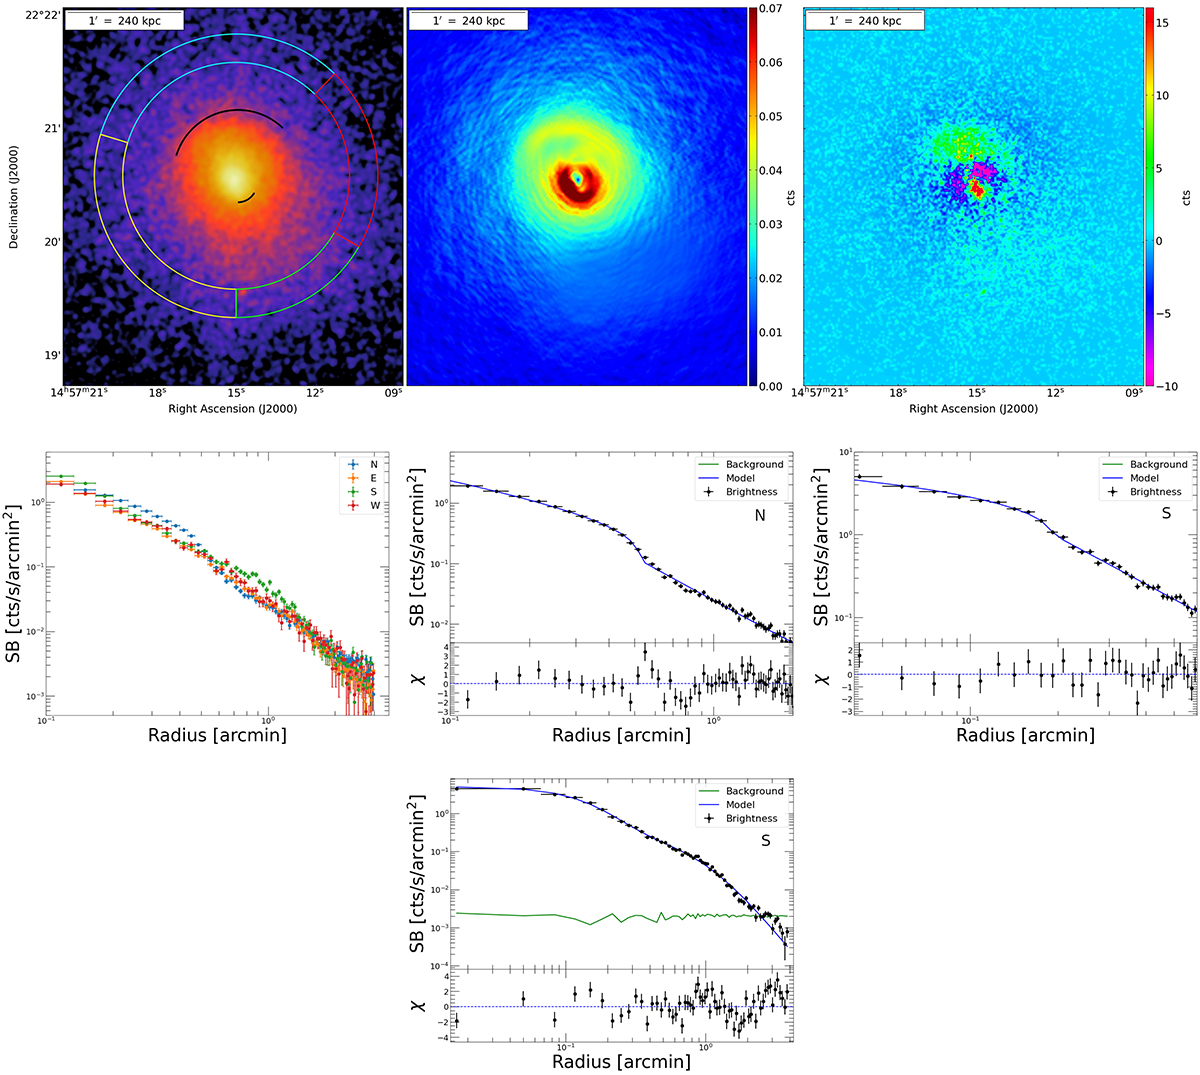
Download original image
X-ray analysis of MS 1455.0+2232. Upper left panel:Chandra 0.5–7.0 keV image, with represented a portion of the extraction regions. Black arcs indicate the position of cold fronts. Upper central panel: GGM filtered image. Upper right panel: Residual image after the subtraction of a double β-model. Middle left panel: SB profiles extracted along the directions depicted in the upper left panel. Middle central panel: best-fitting broken power-law model (blue line) with associated residuals on the SB discontinuity in the N profile. Middle right panel: same as before for the SB discontinuity in the S profile. Lower panel: best-fitting double β-model on the S profile highlighting the SB fluctuation identified by Giacintucci et al. (2024) at r = 1.9′.
Current usage metrics show cumulative count of Article Views (full-text article views including HTML views, PDF and ePub downloads, according to the available data) and Abstracts Views on Vision4Press platform.
Data correspond to usage on the plateform after 2015. The current usage metrics is available 48-96 hours after online publication and is updated daily on week days.
Initial download of the metrics may take a while.