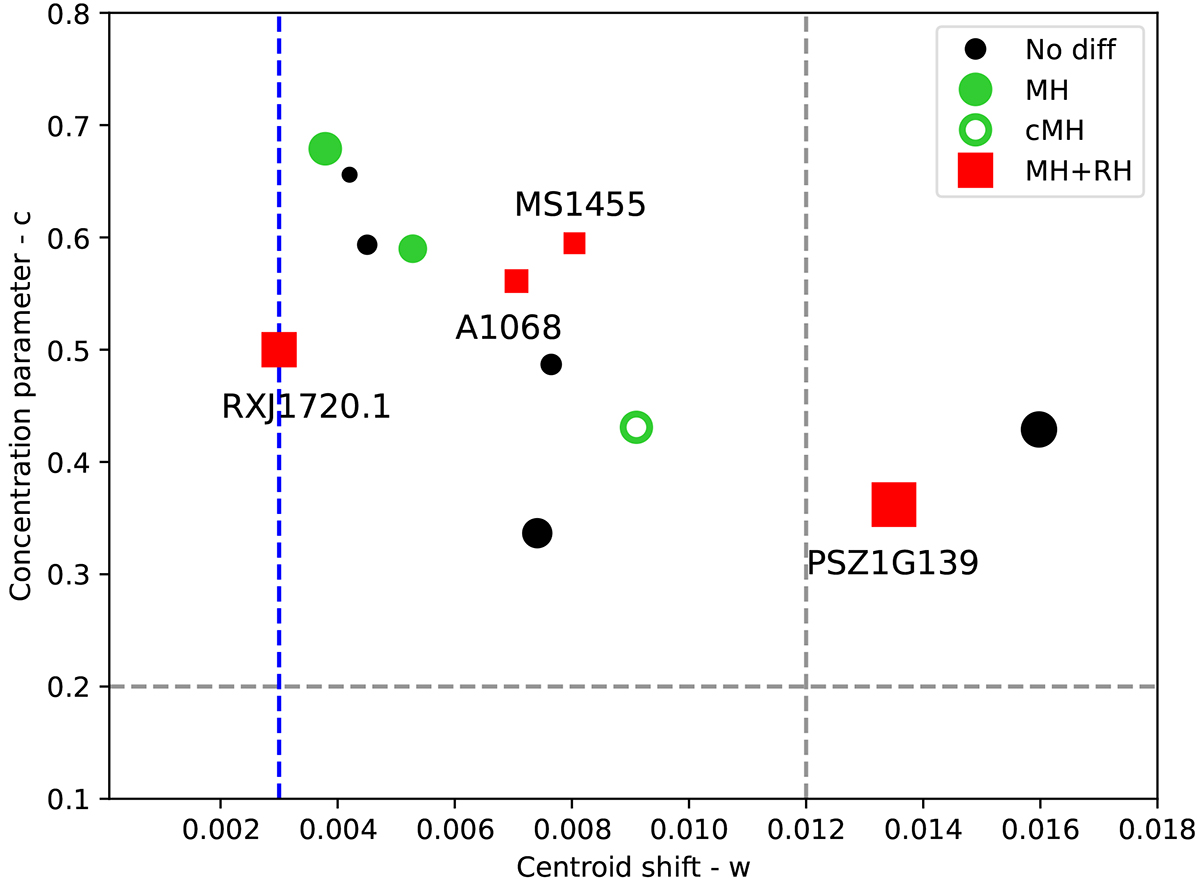
Fig. 22.
Download original image
Morphological parameters’ plot of the clusters in the sample. Colours are associated with the radio morphology detected with LOFAR: clusters without diffuse emission are represented in black, clusters with a MH in green (for the candidate MH we used a marker not filled), and clusters with a double component radio emission (MH+RH) in red. Clusters with detected cold fronts are represented with a square, otherwise a circle is used. The marker size is proportional to the cluster mass. The dashed blue line indicates the w value used to select clusters in our sample. Dashed grey lines indicate the c and w values which separate clusters with a RH (c ≤ 0.2 and w ≥ 0.012) from clusters without a RH, according to Cassano et al. (2010).
Current usage metrics show cumulative count of Article Views (full-text article views including HTML views, PDF and ePub downloads, according to the available data) and Abstracts Views on Vision4Press platform.
Data correspond to usage on the plateform after 2015. The current usage metrics is available 48-96 hours after online publication and is updated daily on week days.
Initial download of the metrics may take a while.