Fig. 21.
Download original image
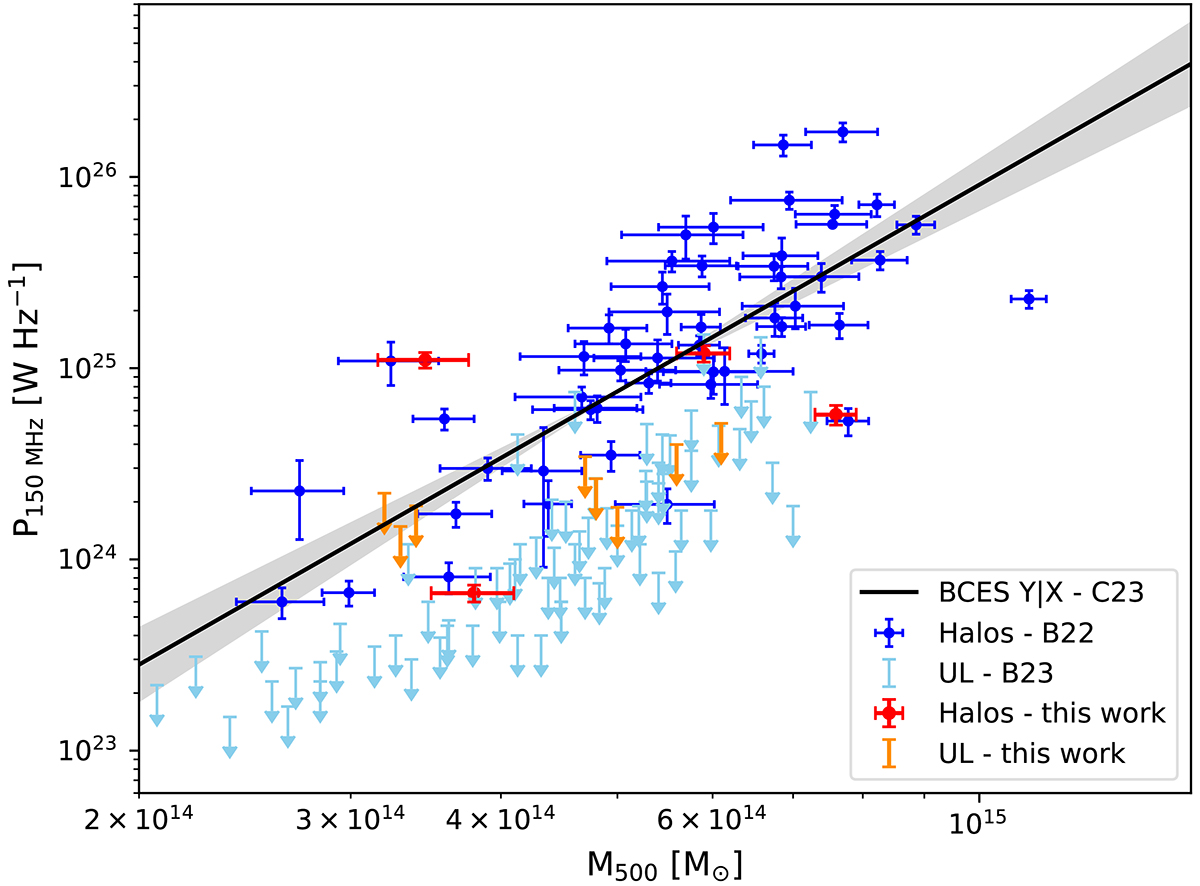
Radio power at 150 MHz vs cluster mass (M500). The clusters with a cluster-scale halo in our sample are indicated in red, while the upper limits we derived for the other clusters in the sample are indicated with orange arrows. RHs in Planck clusters in LoTSS-DR2 (Botteon et al. 2022a) are indicated in blue and their upper limits (Bruno et al. 2023b) in cyan. The black line indicates the correlation found by Cuciti et al. (2023), using a BCES Y|X regression method, while the shaded region shows the associated 3σ region.
Current usage metrics show cumulative count of Article Views (full-text article views including HTML views, PDF and ePub downloads, according to the available data) and Abstracts Views on Vision4Press platform.
Data correspond to usage on the plateform after 2015. The current usage metrics is available 48-96 hours after online publication and is updated daily on week days.
Initial download of the metrics may take a while.