Fig. 19.
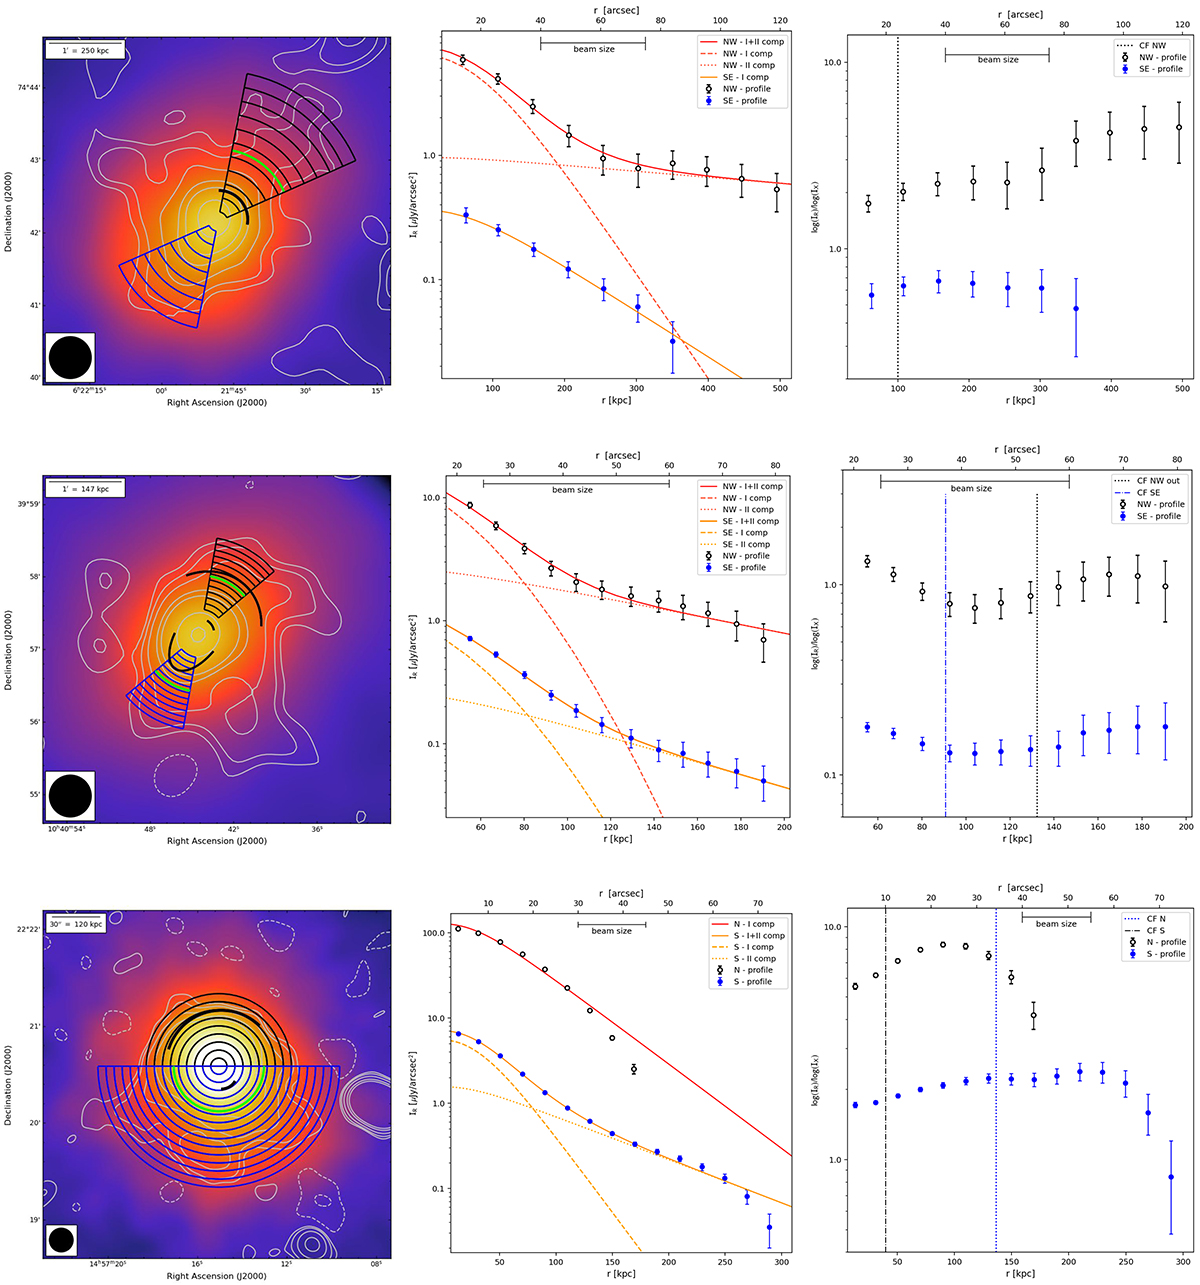
Download original image
Radial profiles of PSZ1G139.61+24 (first row), A1068 (second row), and MS 1455.0+2232 (third row). Left panels: Chandra X-ray maps smoothed to radio resolution (FWHM = 35″for PSZ1G139 and A1068, FWHM = 15″for MS1455), with overlaid LOFAR contours and sectors used to extract radial profiles. The black arcs indicate the position of the cold fronts, while the green arcs indicate the location of the radio discontinuities. Central panels: Radio radial profiles extracted along the sectors indicated in the left panels. Profiles from different sectors have different normalisation for ease of viewing. Solid lines represent the best-fitting model, while dashed and dotted lines represent the best-fitting model of single components of the double exponential, convolved with the radio beam. Right panels: Ratio of the radio and X-ray radial profiles extracted along the same regions reported in the left panels. The dotted vertical lines indicate the position of cold fronts.
Current usage metrics show cumulative count of Article Views (full-text article views including HTML views, PDF and ePub downloads, according to the available data) and Abstracts Views on Vision4Press platform.
Data correspond to usage on the plateform after 2015. The current usage metrics is available 48-96 hours after online publication and is updated daily on week days.
Initial download of the metrics may take a while.