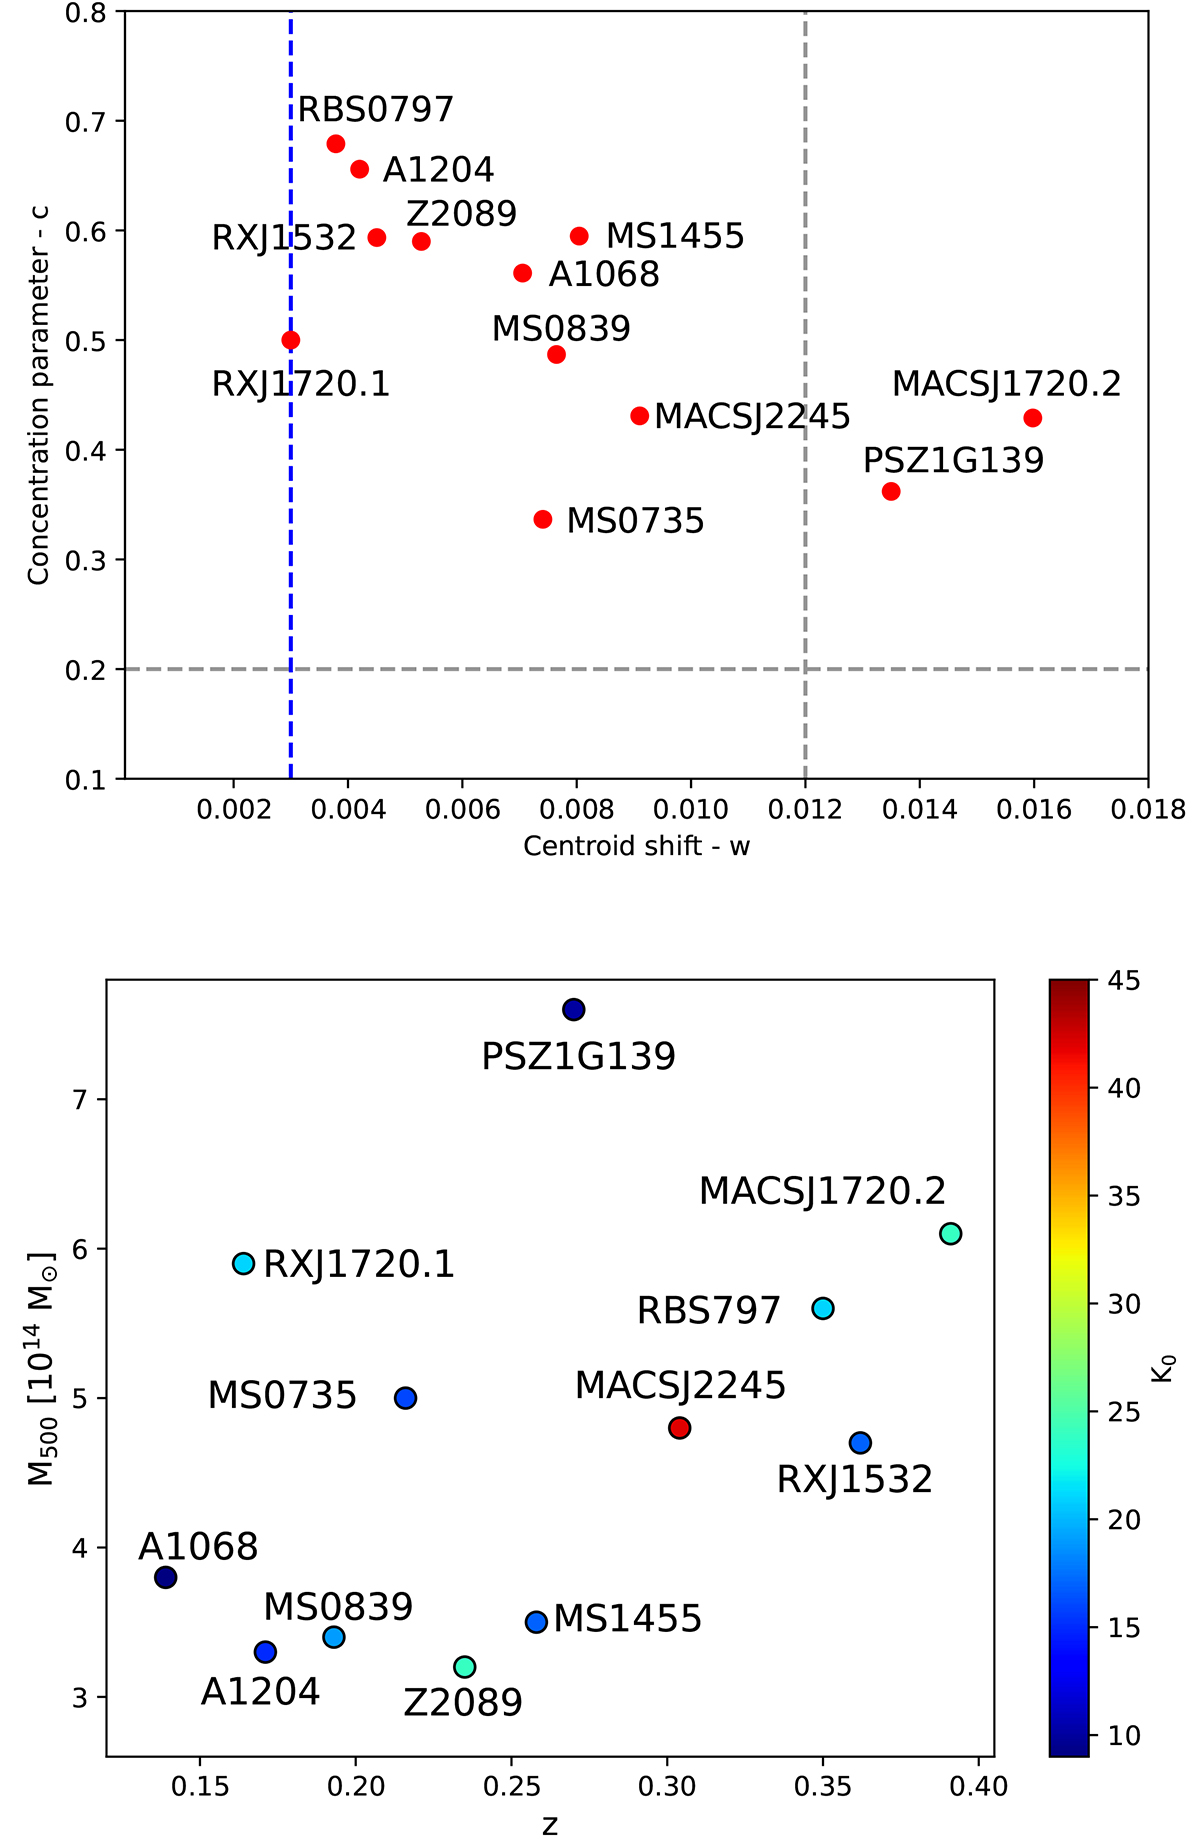
Fig. 1.
Download original image
Physical parameters of selected clusters. Top panel: Morphological parameters’ plot. The dashed blue line indicates the w value used to select clusters in our sample. Dashed grey lines indicate the c and w values that separate clusters with a RH (c ≤ 0.2 and w ≥ 0.012) from clusters without a RH, according to Cassano et al. (2010). Bottom panel: Redshift-mass distribution of clusters coloured according to their central entropy (K0).
Current usage metrics show cumulative count of Article Views (full-text article views including HTML views, PDF and ePub downloads, according to the available data) and Abstracts Views on Vision4Press platform.
Data correspond to usage on the plateform after 2015. The current usage metrics is available 48-96 hours after online publication and is updated daily on week days.
Initial download of the metrics may take a while.