Fig. 9.
Download original image
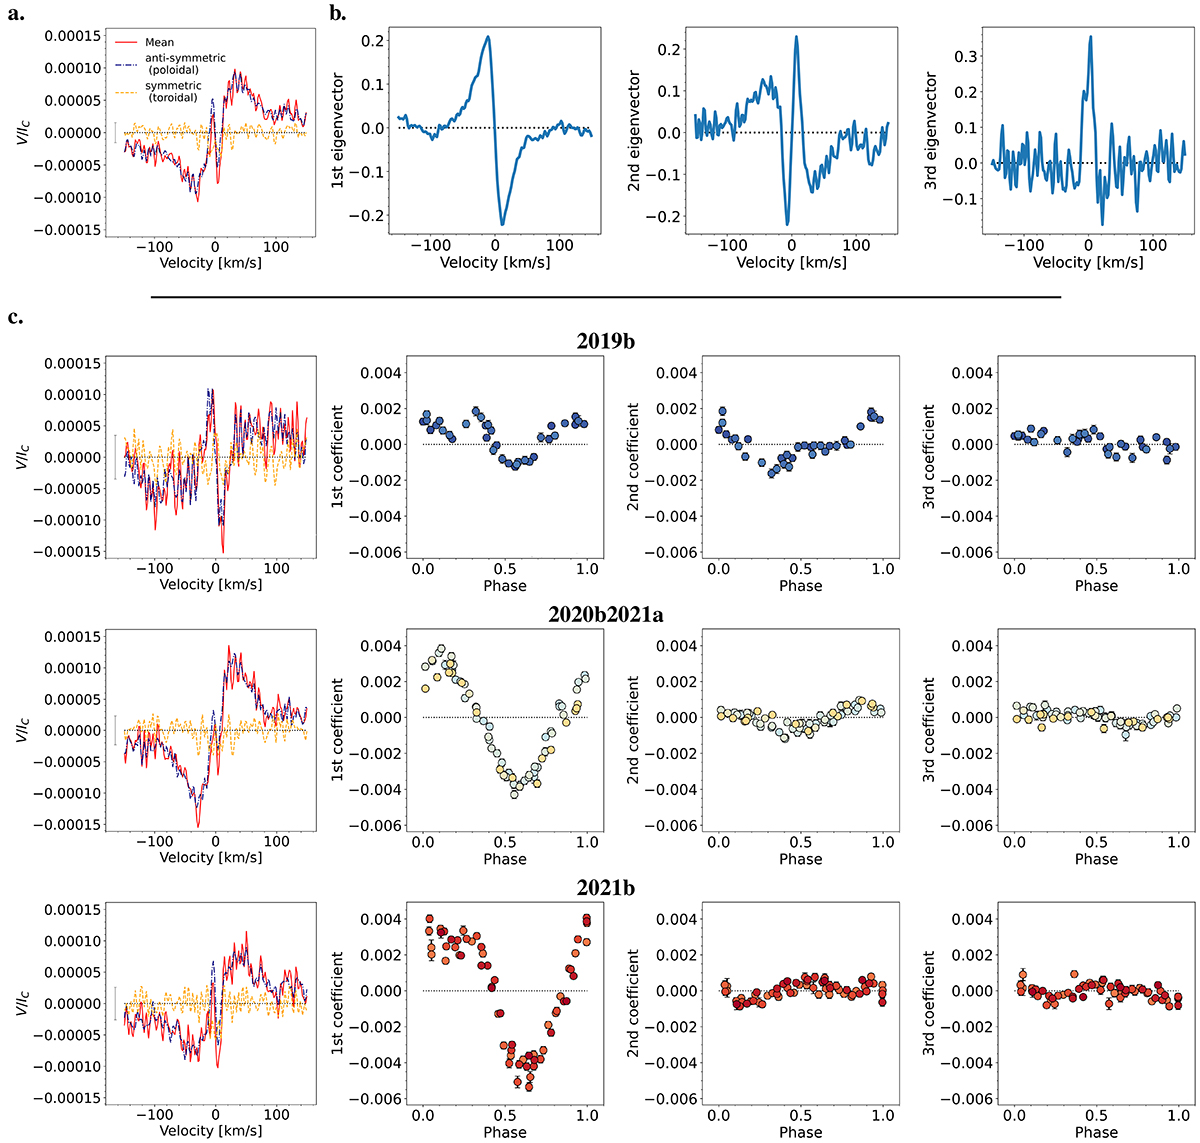
PCA analysis for EV Lac. (a) Mean profile (red) for all observations and its decomposition in the antisymmetric (blue dashed) and symmetric (yellow dotted) component (with respect to the line centre) related to the poloidal and toroidal axisymmetric field, respectively. (b) First three eigenvectors of the mean-subtracted Stokes V profiles. (c) Mean profile (left column), and the coefficients of the first three eigenvectors (three columns to the right) for each season (one season per row). The mean profiles of the individual seasons are plotted in the same format as in panel a. The coefficients are colour-coded by rotation cycle.
Current usage metrics show cumulative count of Article Views (full-text article views including HTML views, PDF and ePub downloads, according to the available data) and Abstracts Views on Vision4Press platform.
Data correspond to usage on the plateform after 2015. The current usage metrics is available 48-96 hours after online publication and is updated daily on week days.
Initial download of the metrics may take a while.