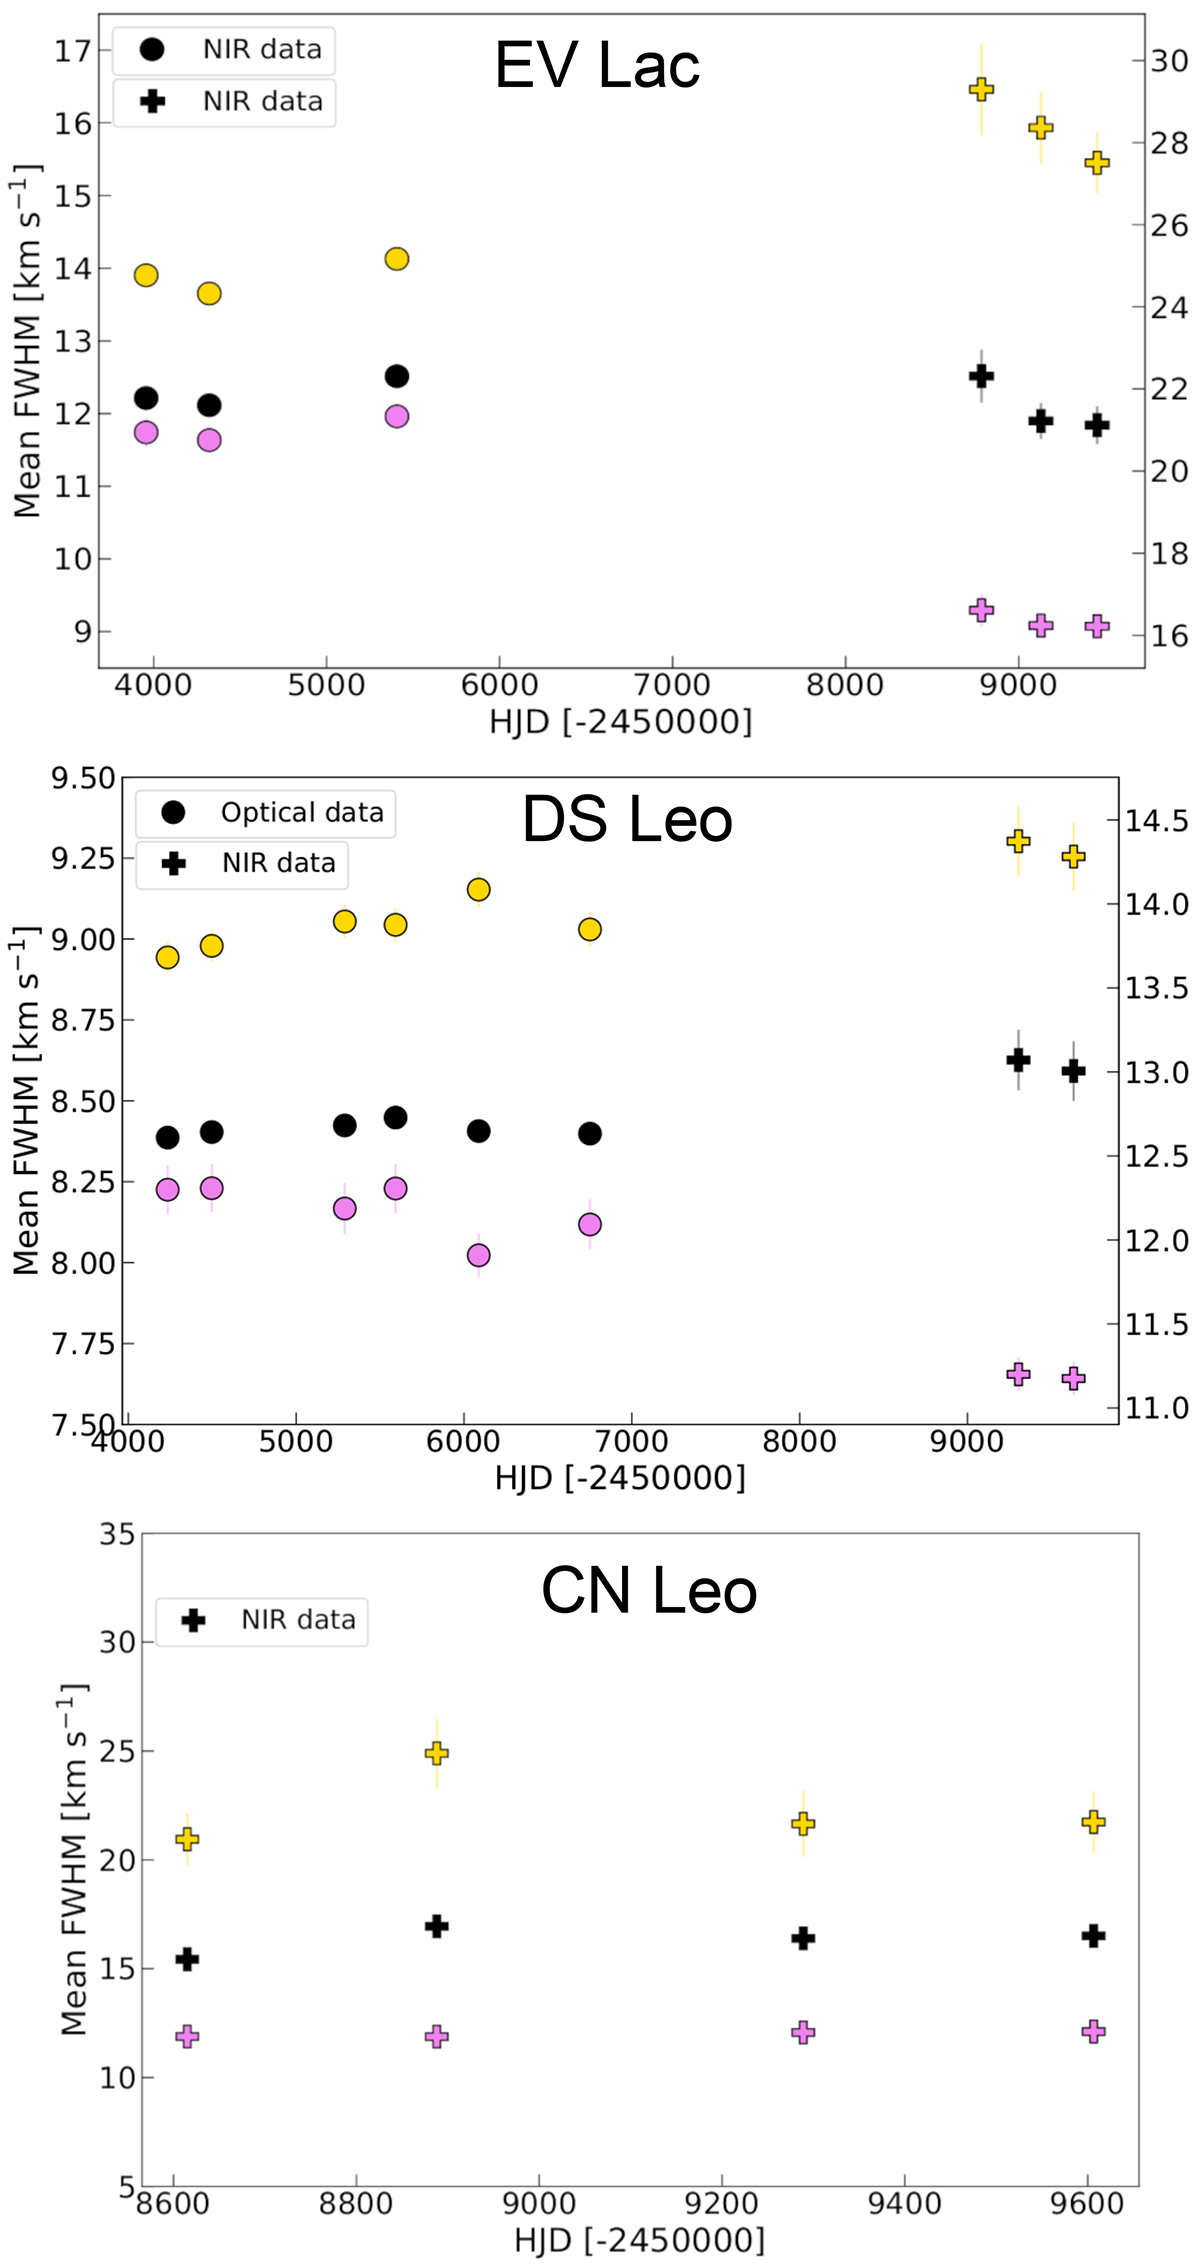
Fig. 8.
Download original image
Long-term evolution of the epoch-averaged FWHM. The panels show the results from optical (circles) and near-infrared (pluses) observations of EV Lac (top), DS Leo (middle), and CN Leo (bottom). In all panels, the data points are colour-coded based on the line mask used for LSD: full (black), low-geff (purple), and high-geff (yellow). The left y-axis refers to the optical observations, and the right y-axis to the near-infrared observations.
Current usage metrics show cumulative count of Article Views (full-text article views including HTML views, PDF and ePub downloads, according to the available data) and Abstracts Views on Vision4Press platform.
Data correspond to usage on the plateform after 2015. The current usage metrics is available 48-96 hours after online publication and is updated daily on week days.
Initial download of the metrics may take a while.