Fig. 3.
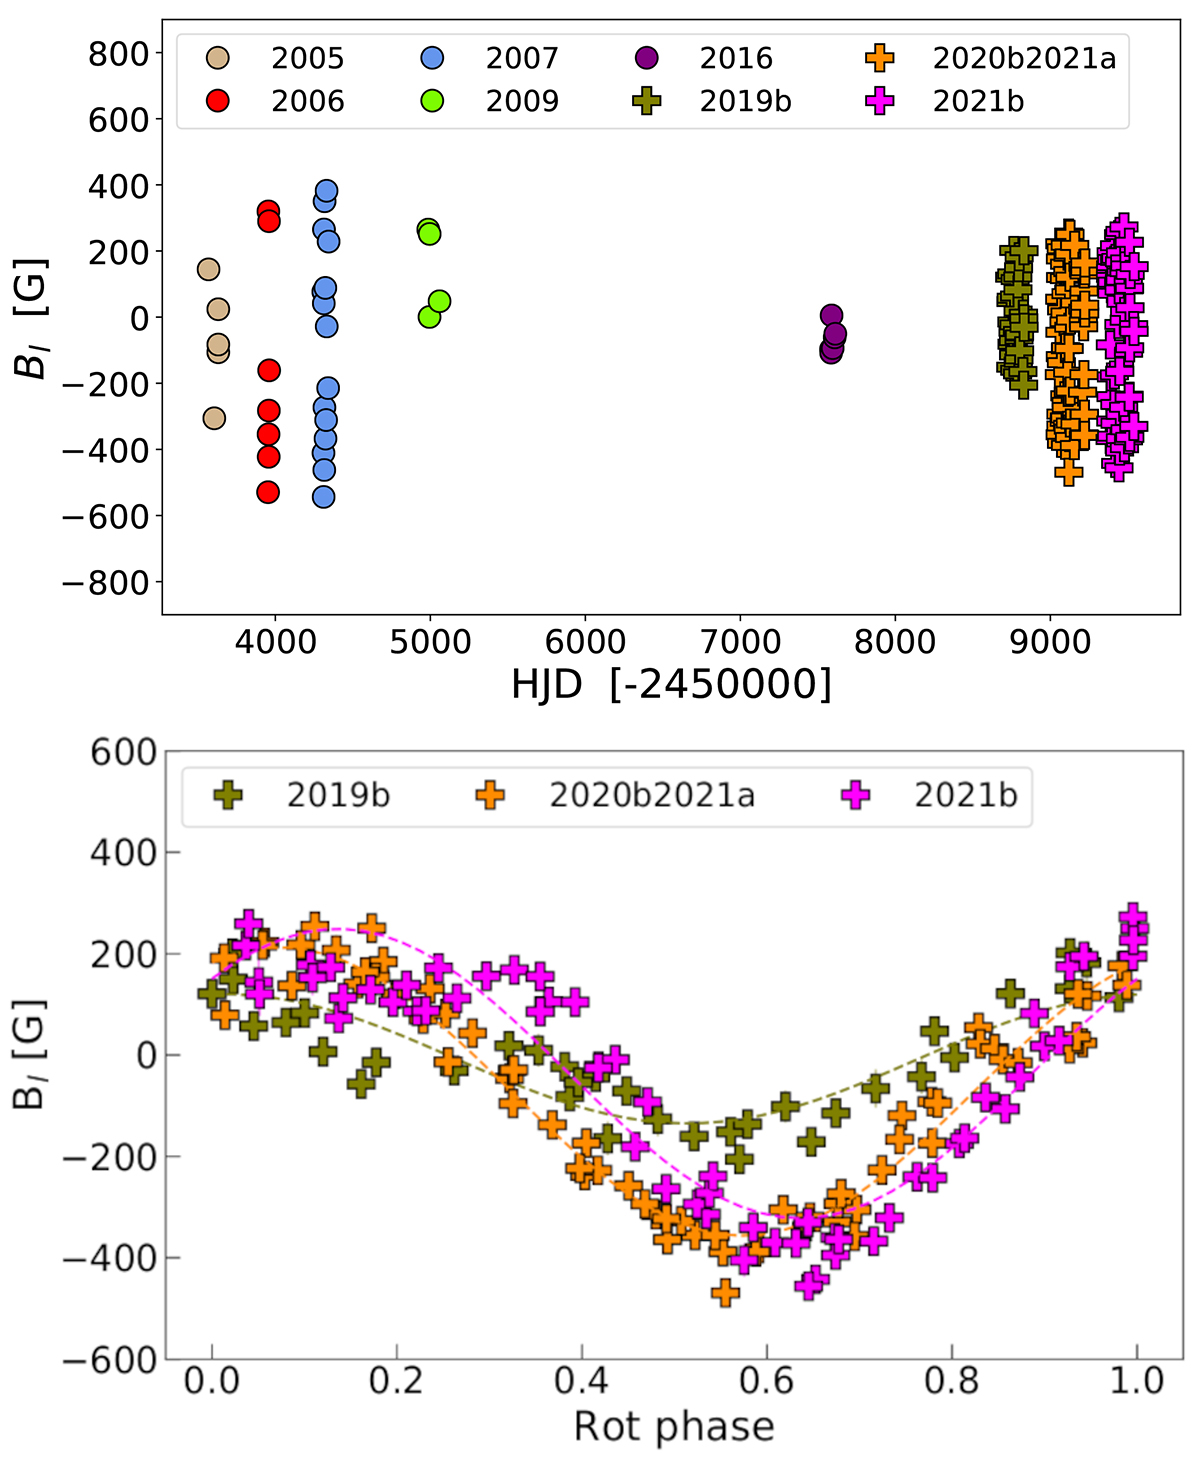
Download original image
Temporal evolution of the longitudinal magnetic field for EV Lac. The shape of the data points distinguishes optical (circles) from near-infrared (squares), and the colour represents the epoch in which the data were collected. Top: full time series of measurements with ESPaDOnS, NARVAL, and SPIRou. Bottom: phase-folded curves of SPIRou data points colour-coded by epoch; the associated least-squares sine fits are shown as dashed lines. The rotation period used is listed in Table 1.
Current usage metrics show cumulative count of Article Views (full-text article views including HTML views, PDF and ePub downloads, according to the available data) and Abstracts Views on Vision4Press platform.
Data correspond to usage on the plateform after 2015. The current usage metrics is available 48-96 hours after online publication and is updated daily on week days.
Initial download of the metrics may take a while.