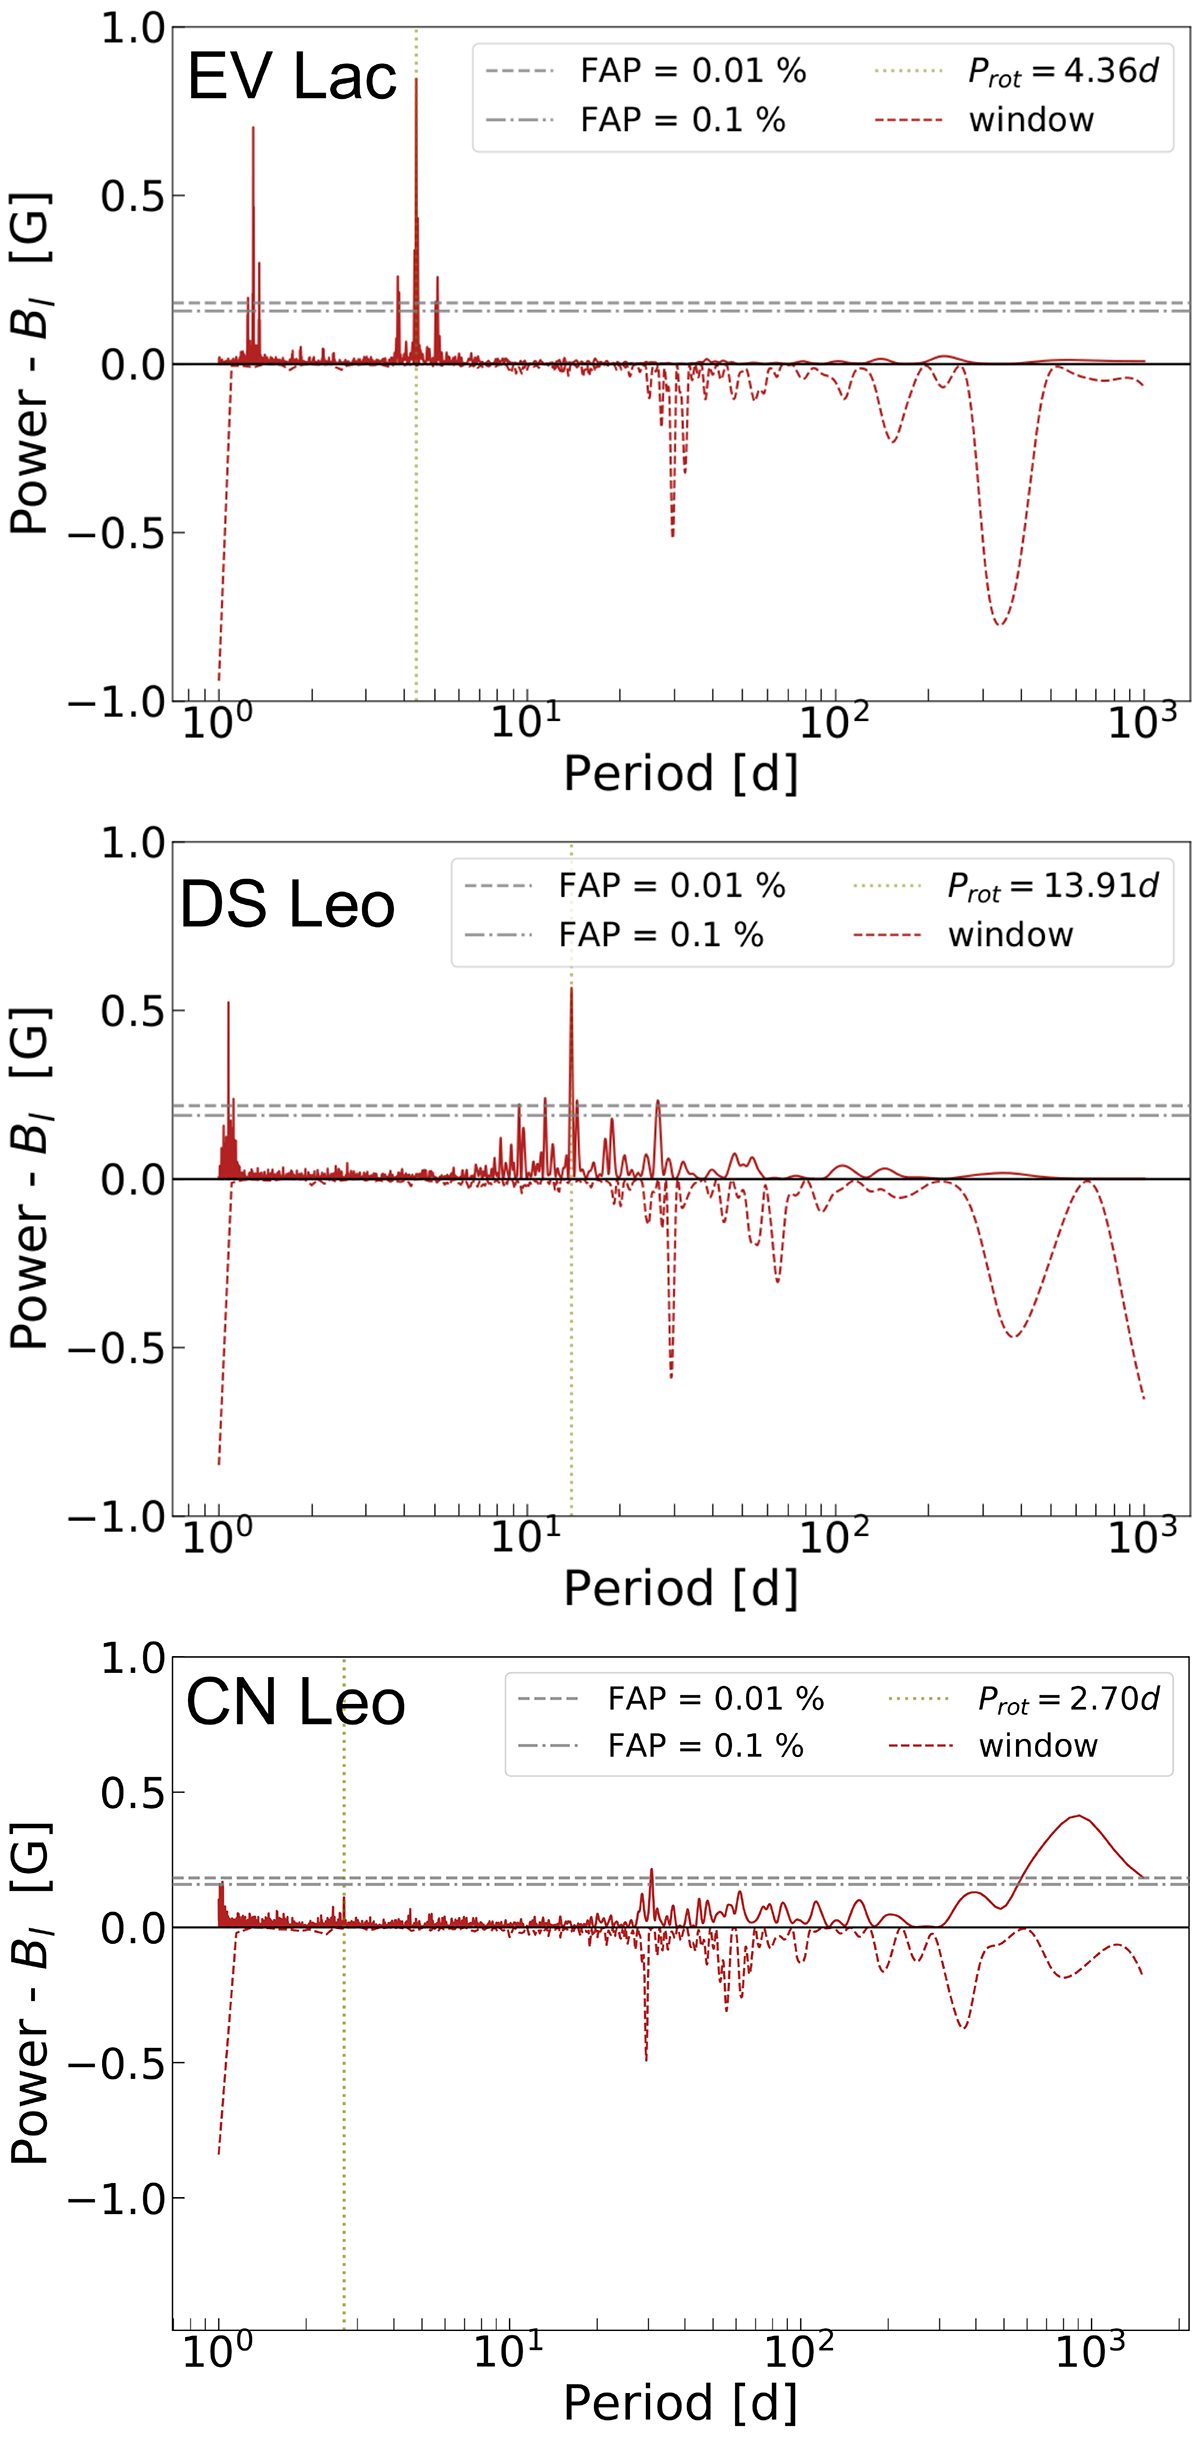
Fig. 2.
Download original image
Generalised Lomb-Scargle periodogram of the longitudinal field near-infrared time series, from top to bottom EV Lac, DS Leo, and CN Leo. In each panel the rotation period corresponding to the highest peak is highlighted with a green dotted line, while two FAP levels (0.1% and 0.01%) are shown as grey horizontal lines. The window function of the entire time series is included and mirrored with respect to the x-axis (VanderPlas 2018) to highlight aliases due to the observation cadence and scheduling.
Current usage metrics show cumulative count of Article Views (full-text article views including HTML views, PDF and ePub downloads, according to the available data) and Abstracts Views on Vision4Press platform.
Data correspond to usage on the plateform after 2015. The current usage metrics is available 48-96 hours after online publication and is updated daily on week days.
Initial download of the metrics may take a while.