Fig. 10.
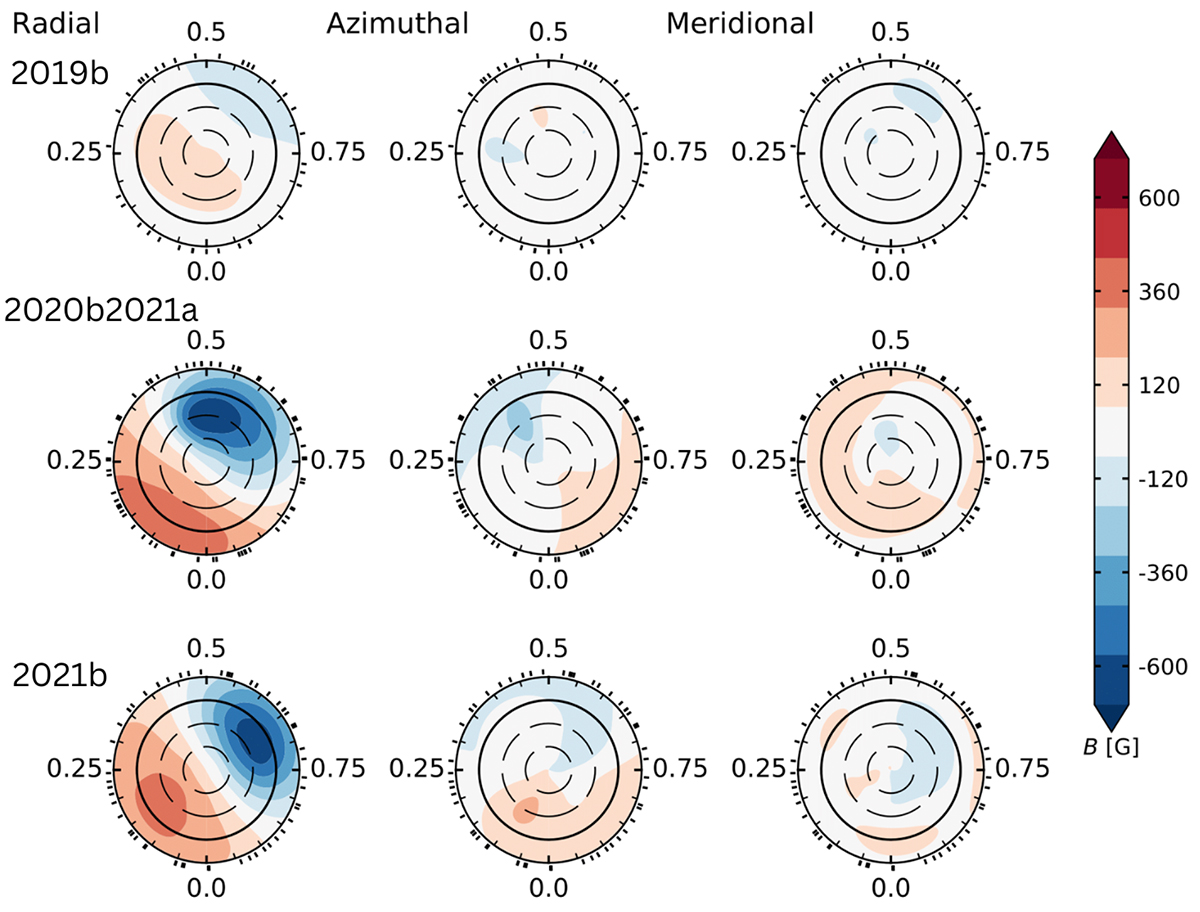
Download original image
Reconstructed ZDI maps in flattened polar view of EV Lac for (from left to right) 2019b, 2020b2021a, and 2021b. In each column the radial (top), azimuthal (middle), and meridional (bottom) components of the magnetic field vector are displayed. The radial ticks are located at the rotational phases when the observations were collected, while the concentric circles represent different stellar latitudes: +30° and +60° (dashed lines), and equator (solid line). The colour bar range is set by the maximum (in absolute value) of the magnetic field and illustrates the positive (red) and negative (blue) magnetic polarity for each epoch.
Current usage metrics show cumulative count of Article Views (full-text article views including HTML views, PDF and ePub downloads, according to the available data) and Abstracts Views on Vision4Press platform.
Data correspond to usage on the plateform after 2015. The current usage metrics is available 48-96 hours after online publication and is updated daily on week days.
Initial download of the metrics may take a while.