Open Access
Fig. 6
Download original image
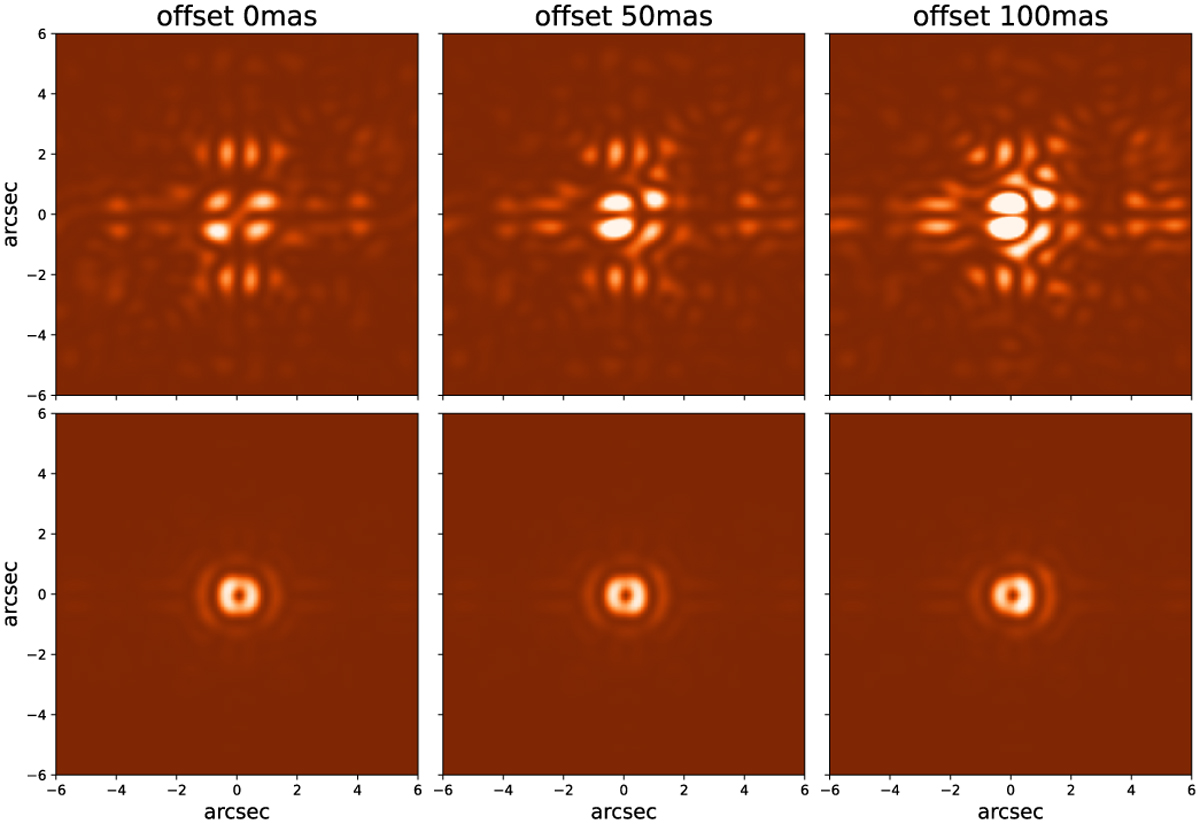
Coronagraphic images simulated in the F1550C filter for a disk size of 2 au (top) and 15 au (bottom) and for three offset amplitudes (0, 50, and 100 mas). The intensity scale is adapted in each panel for visualisation purpose. In contrary to Fig. 5, the orientation of the 4QPM coronagraph is aligned with the image axis.
Current usage metrics show cumulative count of Article Views (full-text article views including HTML views, PDF and ePub downloads, according to the available data) and Abstracts Views on Vision4Press platform.
Data correspond to usage on the plateform after 2015. The current usage metrics is available 48-96 hours after online publication and is updated daily on week days.
Initial download of the metrics may take a while.