Fig. 3
Download original image
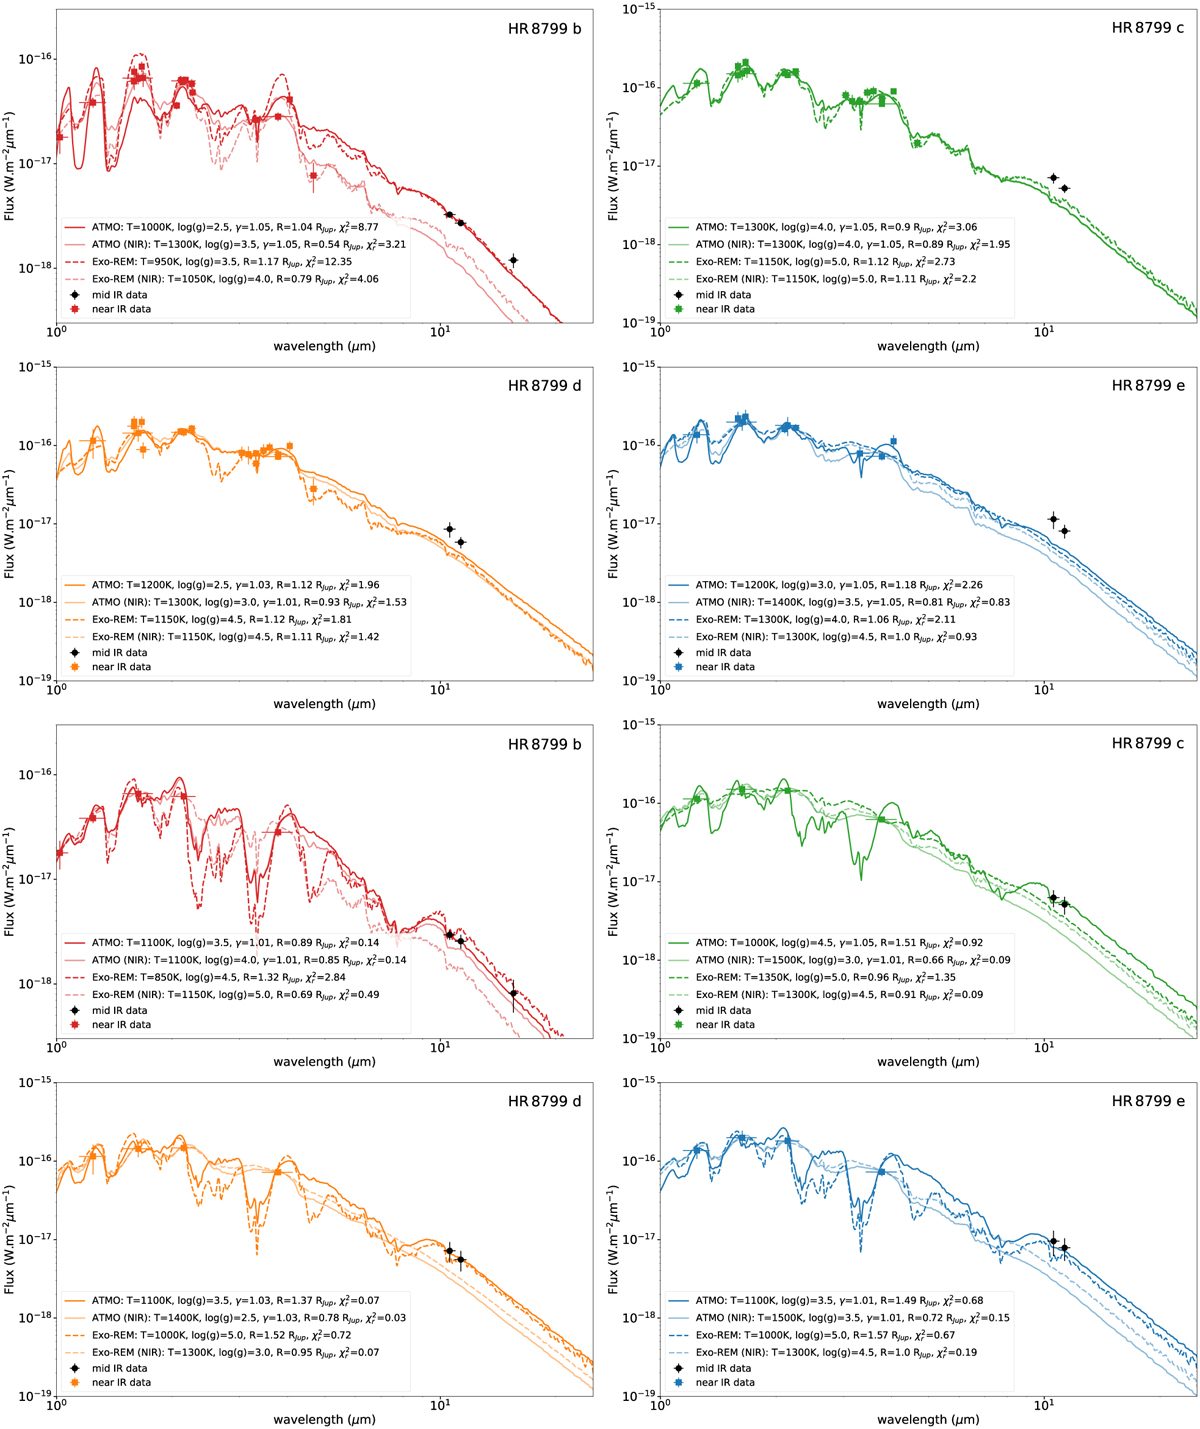
Flux density in W m−2 µm−1 of the best models using ATMO (plain lines) and Exo-REM (dashed lines) fitting the near-IR (colored squares) and mid-IR (black circles) photometric data points for the four planets. The light color lines correspond to the fit of the near-IR data alone. The top four subpanels are for the photometrically calibrated files, and the bottom four are relative to contrast measurements with a reduced number of near-IR data points.
Current usage metrics show cumulative count of Article Views (full-text article views including HTML views, PDF and ePub downloads, according to the available data) and Abstracts Views on Vision4Press platform.
Data correspond to usage on the plateform after 2015. The current usage metrics is available 48-96 hours after online publication and is updated daily on week days.
Initial download of the metrics may take a while.