Fig. 9.
Download original image
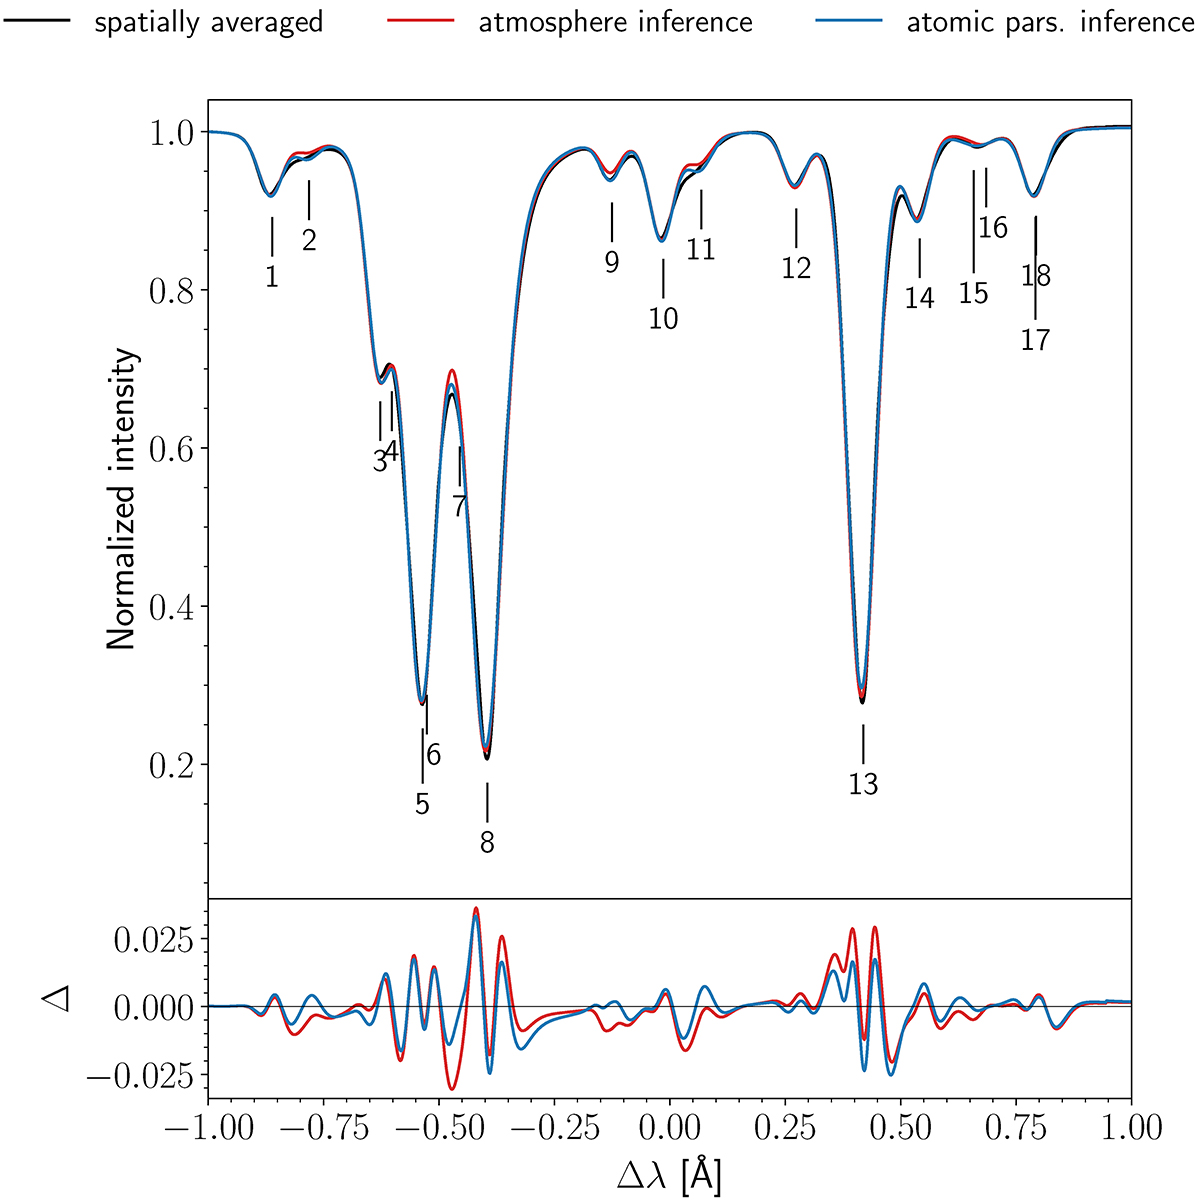
Comparison between the spatially averaged spectrum from the quiet-sun MURaM cube (black line), the spectrum from the inference of the atmospheric model (red line), and the spectrum from the inference of the atomic line parameters (blue line). In the bottom panel, we show the difference between spectra compared to the spatially averaged one.
Current usage metrics show cumulative count of Article Views (full-text article views including HTML views, PDF and ePub downloads, according to the available data) and Abstracts Views on Vision4Press platform.
Data correspond to usage on the plateform after 2015. The current usage metrics is available 48-96 hours after online publication and is updated daily on week days.
Initial download of the metrics may take a while.