Fig. 9
Download original image
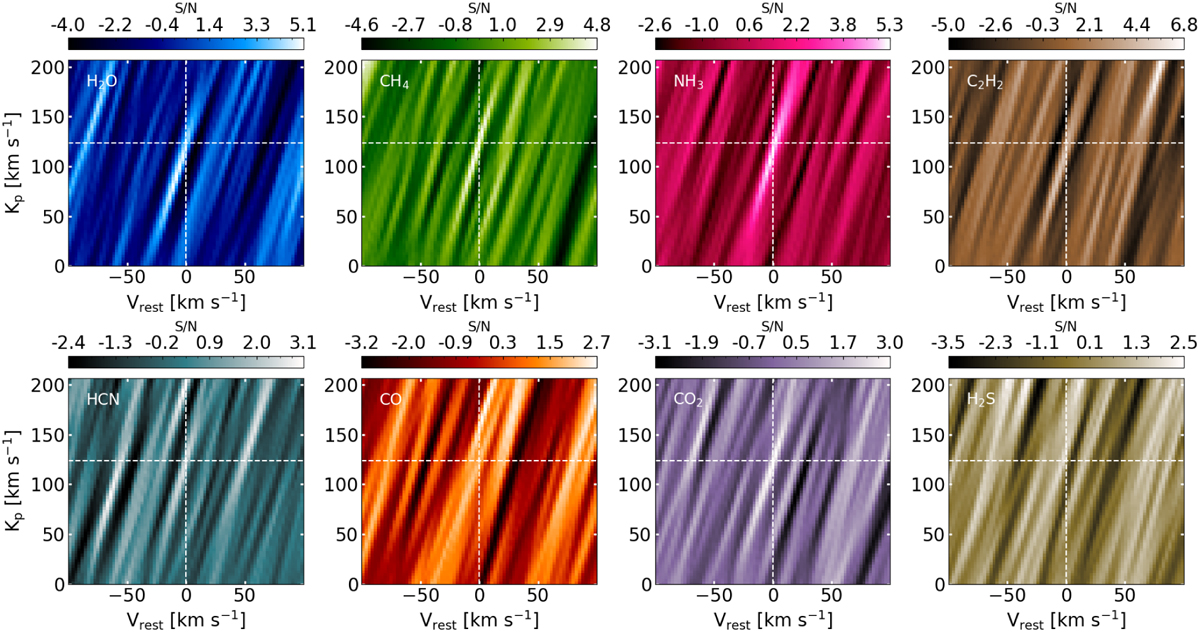
Signal-to-noise ratio Kp – Vrest maps for the probed chemical species: H2O, CH4, NH3, C2H2, HCN, CO, CO2, and H2S. Each Kp – Vrest map shows the S/N of the cross-correlation of the GIANO-B spectra (4 transits combined) with isothermal atmospheric models, as a function of the planet’s RV semi-amplitude (Kp) and the planet’s rest-frame velocity (Vrest). The S/N is computed by dividing the peak value of the cross-correlation function at each Kp by the standard deviation of the noise far from the peak, as described in the text. Negative S/N values correspond to anti-correlation. The vertical and horizontal white dashed lines correspond to Vrest = 0 km s−1 and the expected Kp value (![]() ), respectively.
), respectively.
Current usage metrics show cumulative count of Article Views (full-text article views including HTML views, PDF and ePub downloads, according to the available data) and Abstracts Views on Vision4Press platform.
Data correspond to usage on the plateform after 2015. The current usage metrics is available 48-96 hours after online publication and is updated daily on week days.
Initial download of the metrics may take a while.