Fig. 3
Download original image
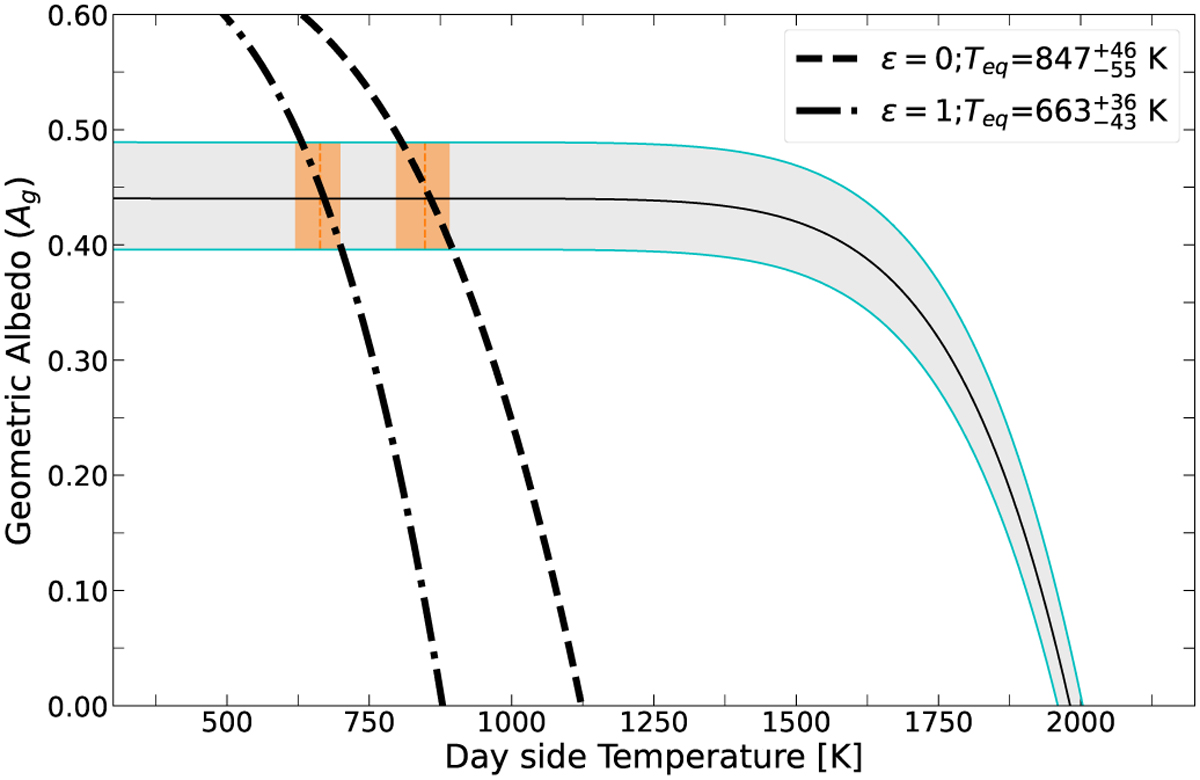
Geometric albedo (Ag) estimated as a function of the day-side temperature for the measured occultation depth ![]() . The cyan lines represent the 1σ uncertainty curves. The dash-dotted and dashed lines represent the variation of Ag with varying Td for the 2 heat re-circulation cases (ε) considered, computed at d = dsec = 14.83 ± 0.30 R⋆ (that is, during the occultation). The 2 orange shaded regions correspond to the intersection of the curves, identifying the average HAT-P-11 b day-side temperatures for the 2 extreme scenarios of ε, computed at d = dsec. These 2 values of the equilibrium temperature with the associated uncertainties are reported in the legend.
. The cyan lines represent the 1σ uncertainty curves. The dash-dotted and dashed lines represent the variation of Ag with varying Td for the 2 heat re-circulation cases (ε) considered, computed at d = dsec = 14.83 ± 0.30 R⋆ (that is, during the occultation). The 2 orange shaded regions correspond to the intersection of the curves, identifying the average HAT-P-11 b day-side temperatures for the 2 extreme scenarios of ε, computed at d = dsec. These 2 values of the equilibrium temperature with the associated uncertainties are reported in the legend.
Current usage metrics show cumulative count of Article Views (full-text article views including HTML views, PDF and ePub downloads, according to the available data) and Abstracts Views on Vision4Press platform.
Data correspond to usage on the plateform after 2015. The current usage metrics is available 48-96 hours after online publication and is updated daily on week days.
Initial download of the metrics may take a while.