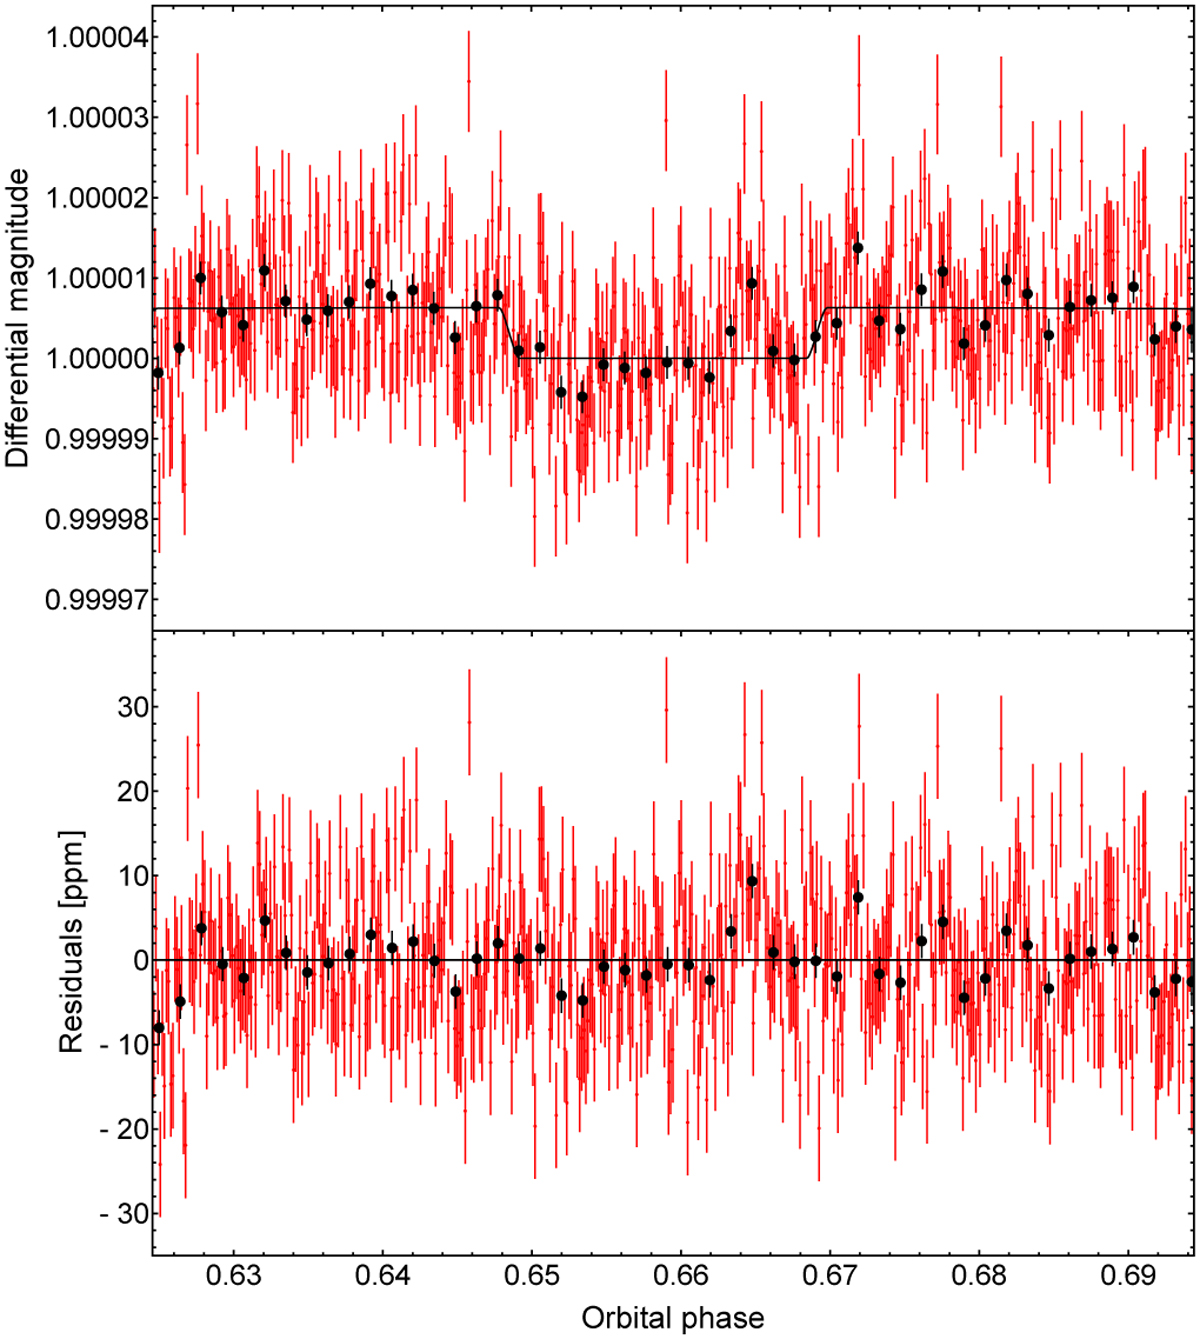
Fig. 2
Download original image
Occultation light curve analysis. Top panel: phase-folded Kepler occultation light curve of HAT-P-11 b binned by 1 min, based on 196 occultations (see text). Our best-fitting model of the occultation in the Kepler bandpass is overplotted with a black solid line. The data have been binned for clarity (black dots with error bars). Bottom panel: residuals of the fit.
Current usage metrics show cumulative count of Article Views (full-text article views including HTML views, PDF and ePub downloads, according to the available data) and Abstracts Views on Vision4Press platform.
Data correspond to usage on the plateform after 2015. The current usage metrics is available 48-96 hours after online publication and is updated daily on week days.
Initial download of the metrics may take a while.