Open Access
Fig. E.1
Download original image
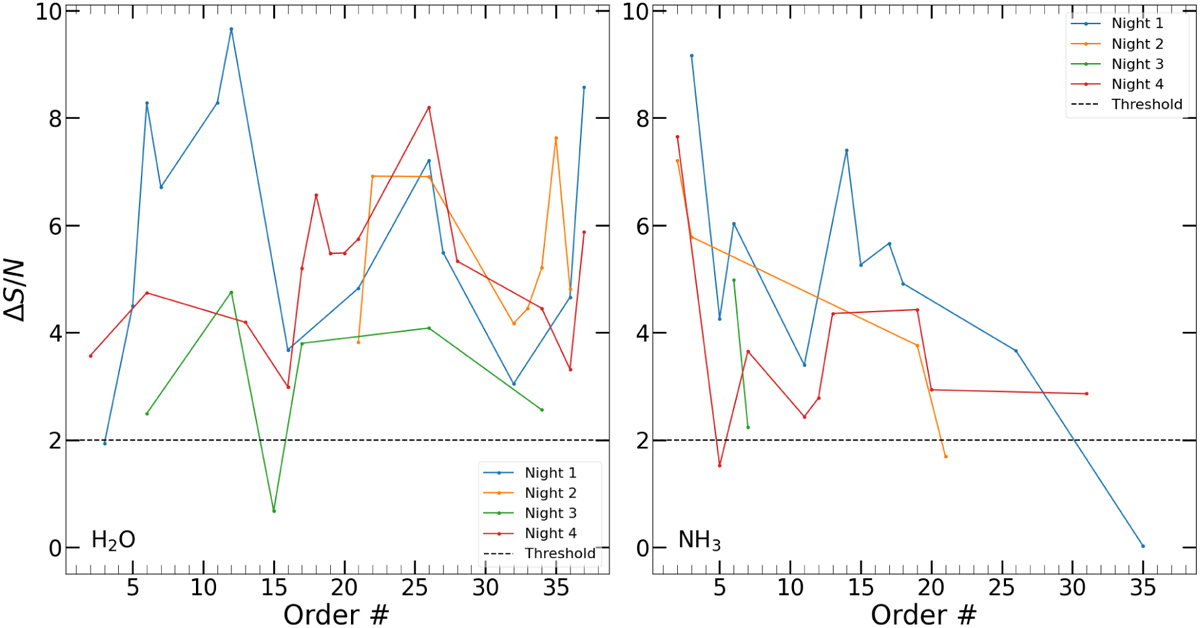
Change in S/N (ΔS/N) due to the injection of the model of H2O (left) and NH3 (right) into the data, as a function of the selected spectral orders in the different nights. The black horizontal dashed line represents the 2 σ threshold.
Current usage metrics show cumulative count of Article Views (full-text article views including HTML views, PDF and ePub downloads, according to the available data) and Abstracts Views on Vision4Press platform.
Data correspond to usage on the plateform after 2015. The current usage metrics is available 48-96 hours after online publication and is updated daily on week days.
Initial download of the metrics may take a while.