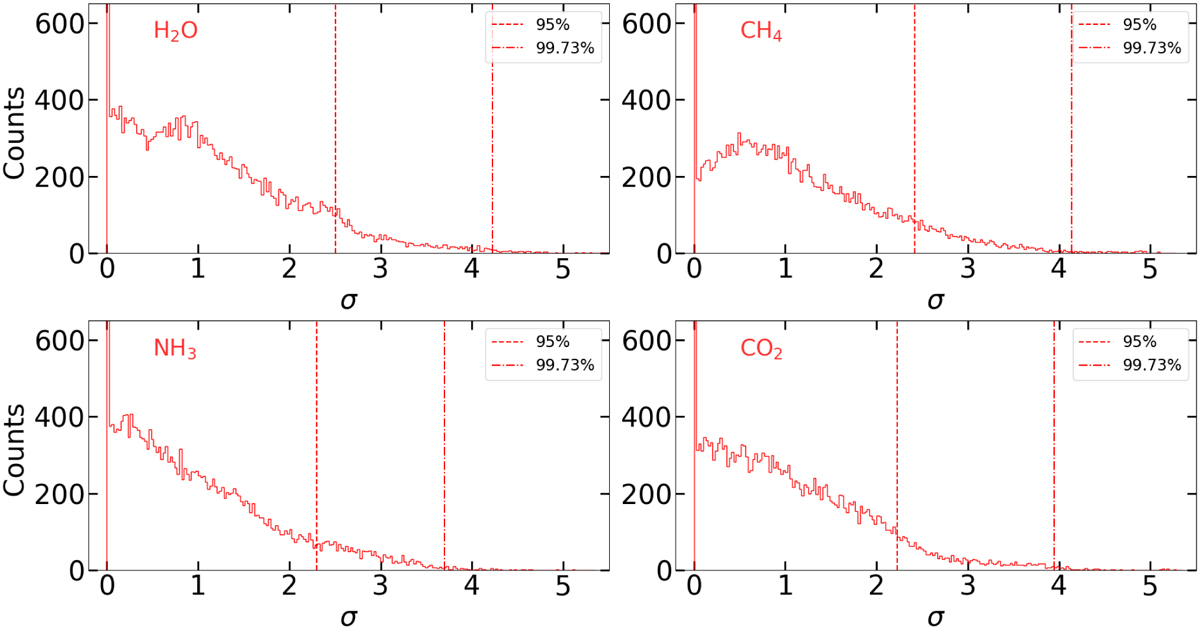
Fig. C.2
Download original image
Distribution of significance (from the t-test) obtained in the selected Kp – Vrest interval by shuffling 250 times the time order of the observed spectra, for each of the four selected chemical species. The vertical dashed (dash-dotted) lines represent the borders of the intervals enclosing the 95% (99.73%) of the significance values, corresponding to the 95% (99.73%) quantile of the distributions. These intervals are reported in Table 4. Since the 50% of the significance values (~20 000 values) are <0.2 σ for all the 4 chemical species, the plots of the distributions are limited on the y-axis in the interval [0; 650] for clarity.
Current usage metrics show cumulative count of Article Views (full-text article views including HTML views, PDF and ePub downloads, according to the available data) and Abstracts Views on Vision4Press platform.
Data correspond to usage on the plateform after 2015. The current usage metrics is available 48-96 hours after online publication and is updated daily on week days.
Initial download of the metrics may take a while.