Fig. 13
Download original image
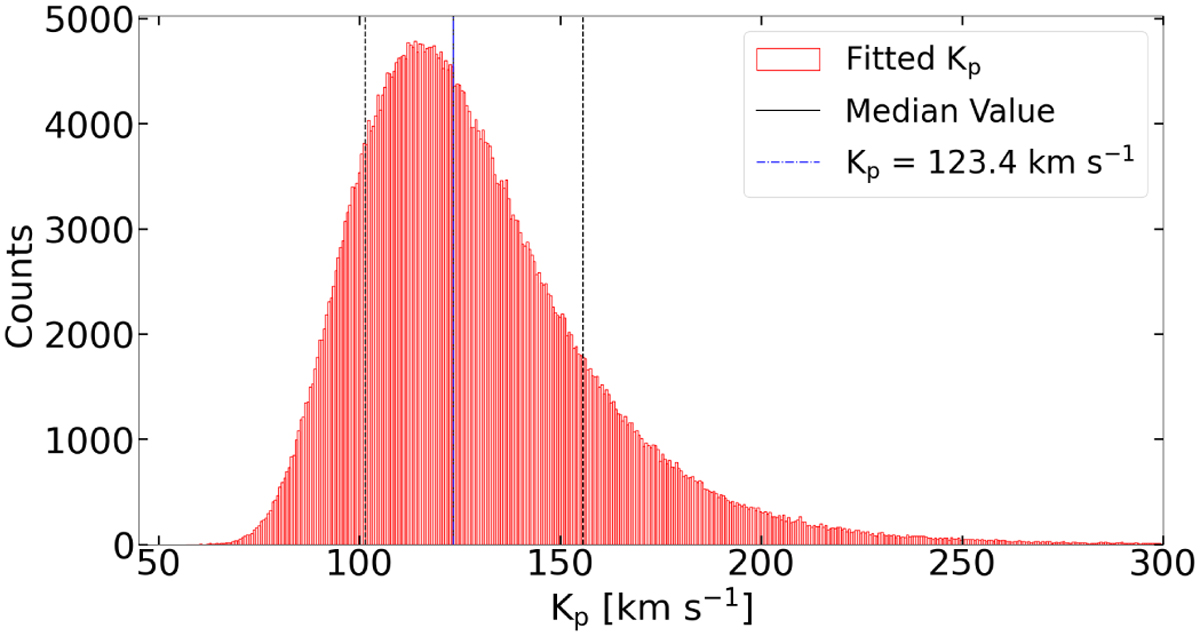
Distribution of Kp values fitted on randomly generated planetary RV curves with properties described in the text. The vertical black solid line represents the median value of the distribution, while the 2 vertical black dashed lines represent the 2 quantile values delimiting the 68% (1 σ) interval of Kp around the median. The vertical dash-dotted blue line represents the expected Kp value: ![]() = 123.4 km s−1. The median and the expected values are coincident and therefore they are not visibly distinguishable.
= 123.4 km s−1. The median and the expected values are coincident and therefore they are not visibly distinguishable.
Current usage metrics show cumulative count of Article Views (full-text article views including HTML views, PDF and ePub downloads, according to the available data) and Abstracts Views on Vision4Press platform.
Data correspond to usage on the plateform after 2015. The current usage metrics is available 48-96 hours after online publication and is updated daily on week days.
Initial download of the metrics may take a while.