Open Access
Fig. 1
Download original image
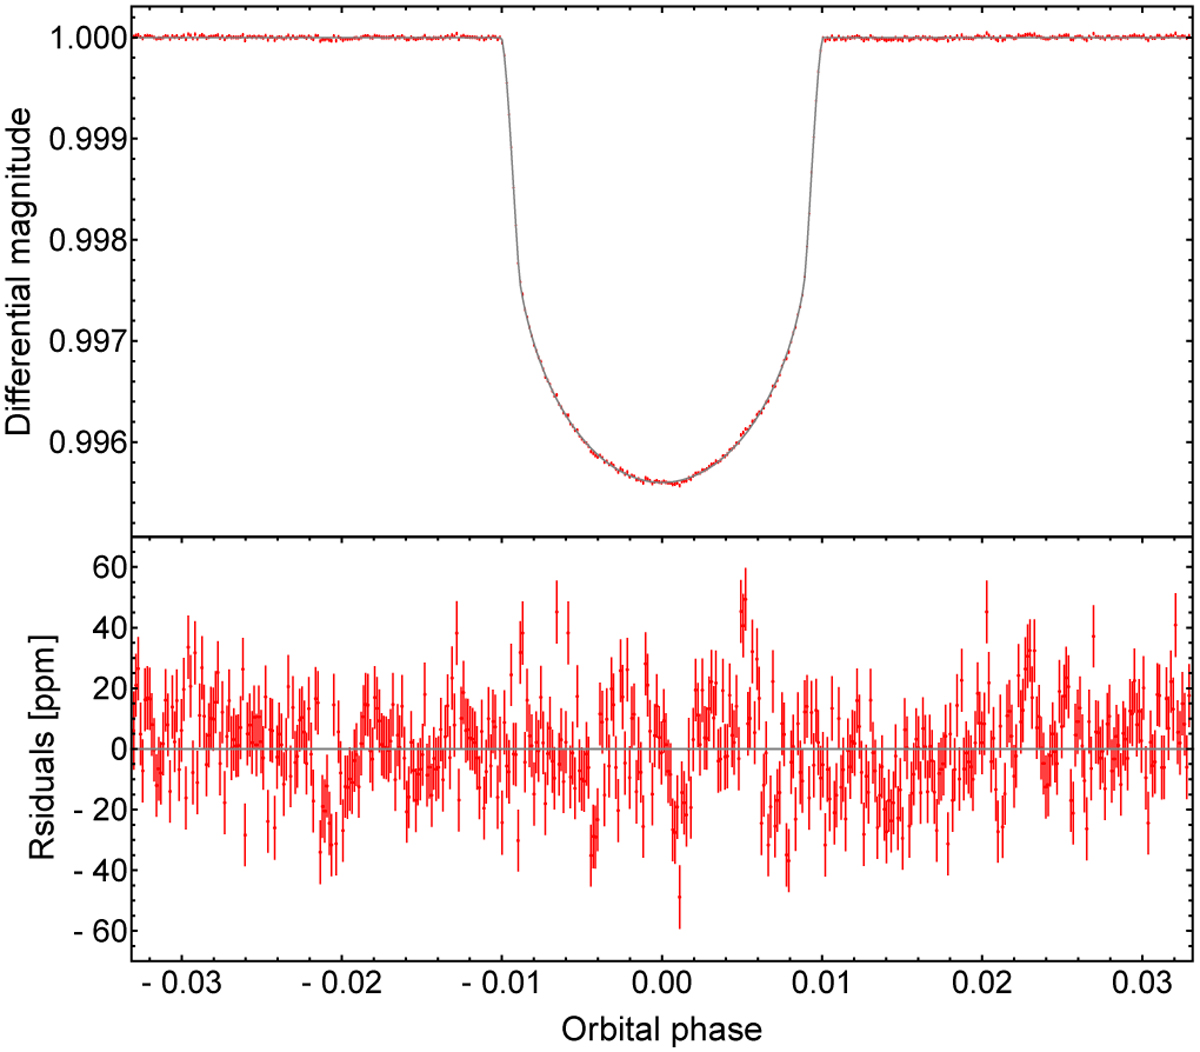
Transit light curve analysis. Top panel: phase-folded Kepler transit light curve of HAT-P-11 b binned by 1 min, based on 64 bona fide transits (see text). Our best-fitting model of the transit in the Kepler bandpass is overplotted in grey. Bottom panel: residuals of the fit.
Current usage metrics show cumulative count of Article Views (full-text article views including HTML views, PDF and ePub downloads, according to the available data) and Abstracts Views on Vision4Press platform.
Data correspond to usage on the plateform after 2015. The current usage metrics is available 48-96 hours after online publication and is updated daily on week days.
Initial download of the metrics may take a while.