Open Access
Fig. A.1
Download original image
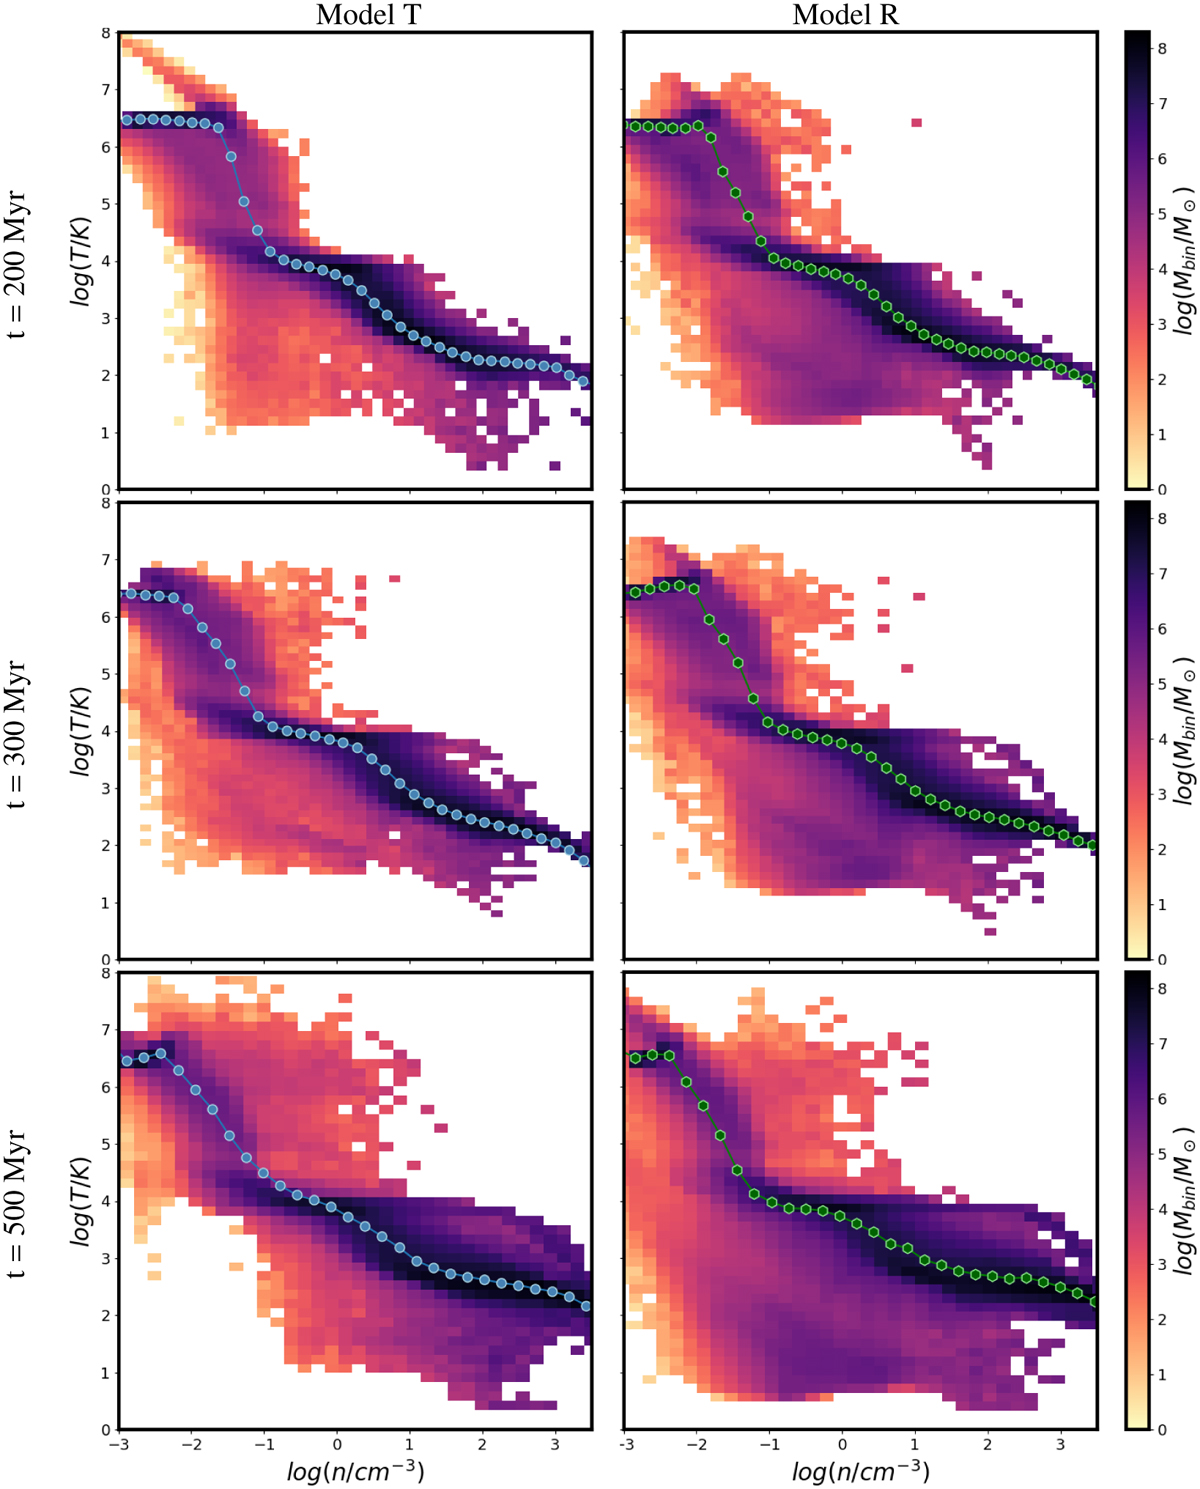
2D mass-weighted histograms of the logarithm of the temperature of the gas plotted against log(n) for model T (left) and model R (right) at t = 200, 300, and 500 Myr. The colored dots represent the mean temperature per density bin.
Current usage metrics show cumulative count of Article Views (full-text article views including HTML views, PDF and ePub downloads, according to the available data) and Abstracts Views on Vision4Press platform.
Data correspond to usage on the plateform after 2015. The current usage metrics is available 48-96 hours after online publication and is updated daily on week days.
Initial download of the metrics may take a while.