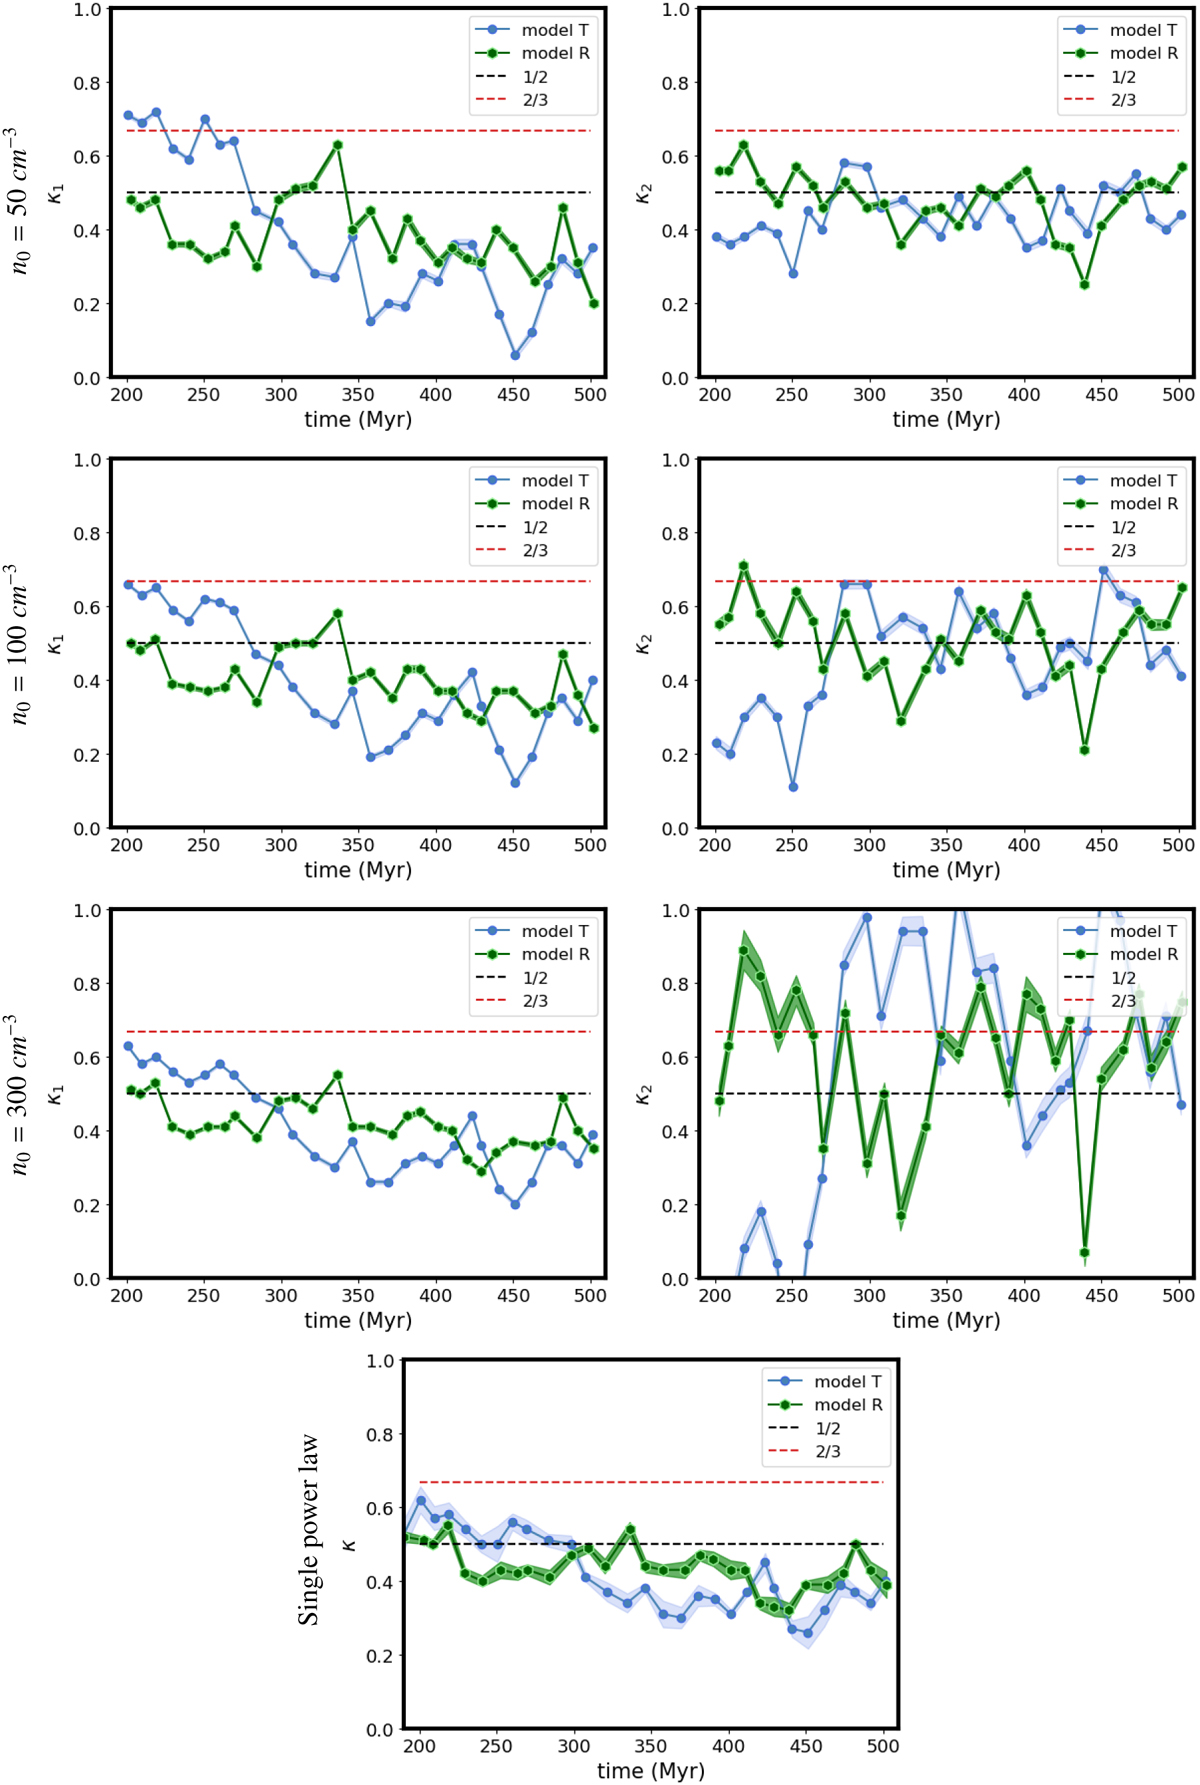
Fig. 8
Download original image
Evolution of the B − ρ slopes (κ1,κ2) and the slope, κ, from the single power-law fit as a function of time for model T (blue) and model R (green) for intermediate (left) and high densities (right). The different transition densities for the broken power-law fit are indicated as labels on the left. The definition of the broken power-law fit is given in Eq. (10). The shaded areas correspond to the standard deviation error on the slopes derived from the fit. The dashed black and red lines show the slopes of 1/2 and 2/3, respectively.
Current usage metrics show cumulative count of Article Views (full-text article views including HTML views, PDF and ePub downloads, according to the available data) and Abstracts Views on Vision4Press platform.
Data correspond to usage on the plateform after 2015. The current usage metrics is available 48-96 hours after online publication and is updated daily on week days.
Initial download of the metrics may take a while.