Fig. 7
Download original image
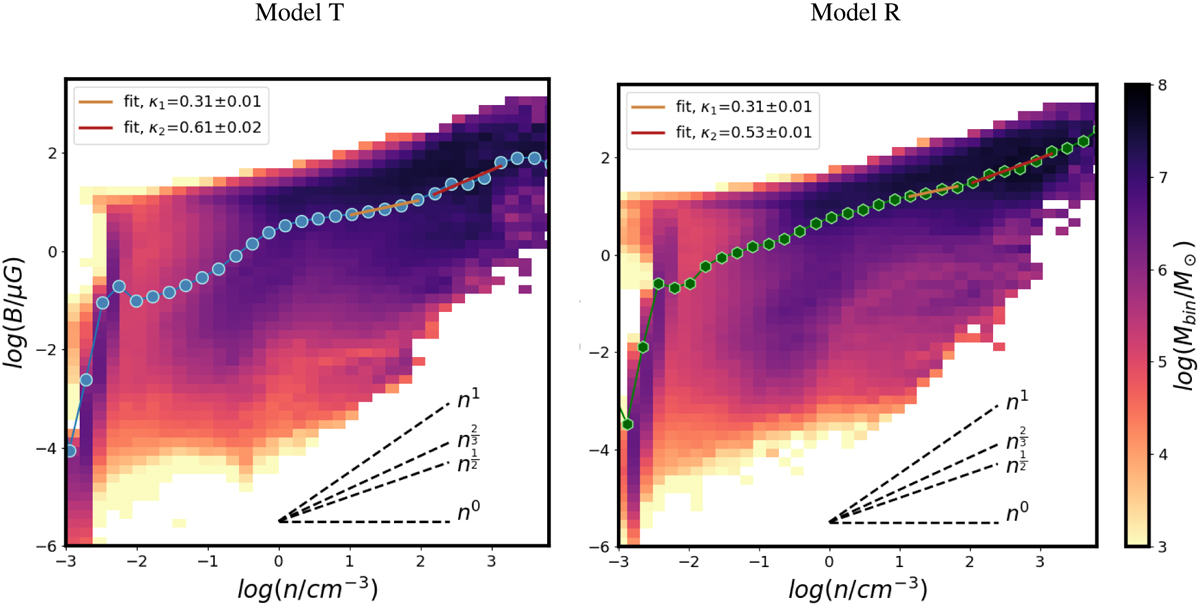
|B| versus n for the two models at t = 470 Myr with model T (left) and the model R (right). The B − ρ relations are given as 2D mass-weighted histograms in the log B-log n space. The dots indicate the mean magnetic field strength per density bin. The yellow and red lines are the power-law fits, with slopes given in the legend of each plot. The B − ρ relations derived from Mestel (1965), Mouschovias (1976a,b), and Tritsis et al. (2015) are reported with dashed black lines.
Current usage metrics show cumulative count of Article Views (full-text article views including HTML views, PDF and ePub downloads, according to the available data) and Abstracts Views on Vision4Press platform.
Data correspond to usage on the plateform after 2015. The current usage metrics is available 48-96 hours after online publication and is updated daily on week days.
Initial download of the metrics may take a while.