Fig. 6
Download original image
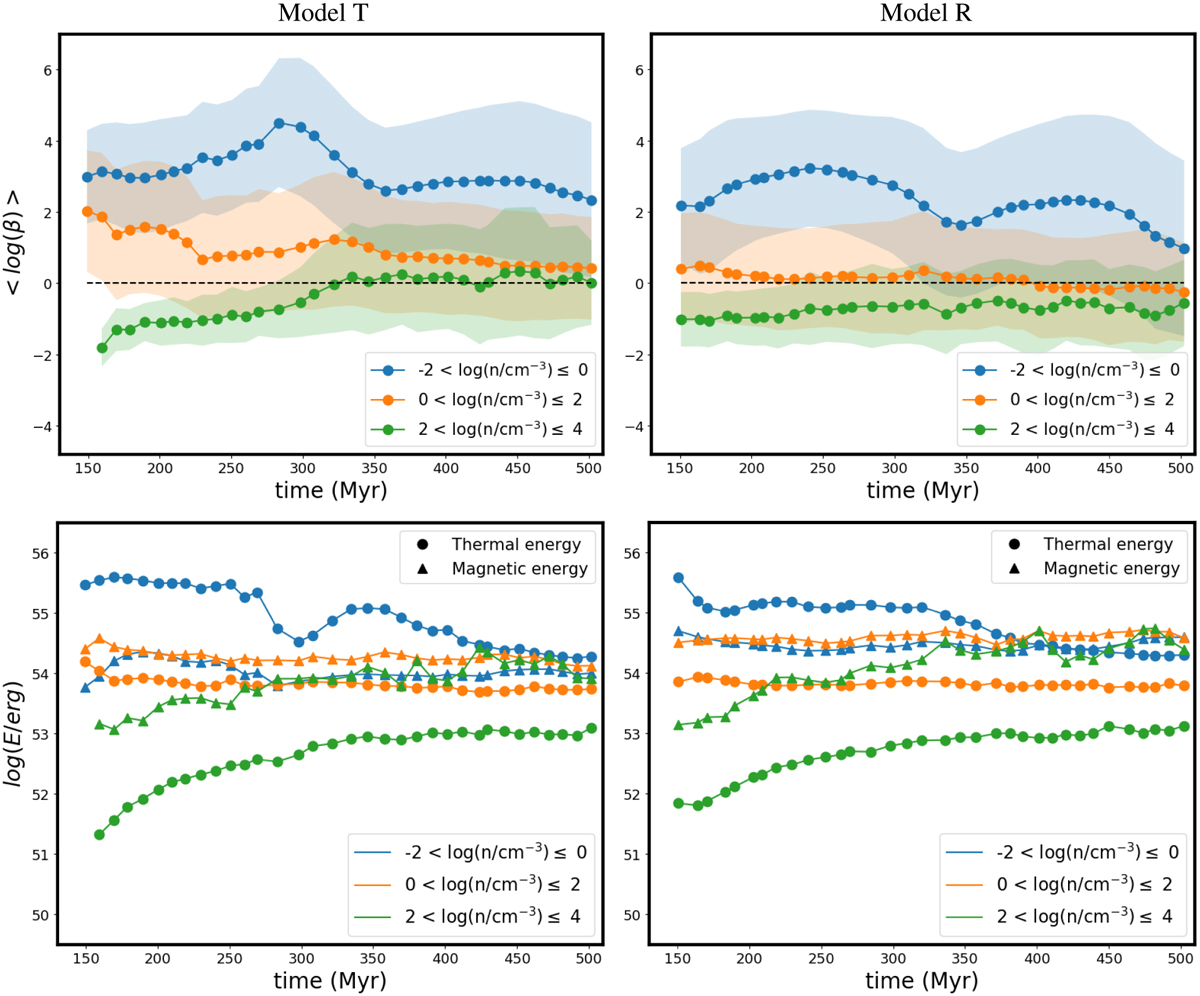
Evolution of 〈log β〉 (top) and total energies (bottom) for three different phases of the gas. The blue, orange, and green lines show the gas in a low (−2 < log(n/cm−3) ≤ 0), medium (0 < log(n/cm−3) ≤ 2), and high (2 < log(n/cm−3) ≤ 4) density phase, respectively, for model T (left) and model R (right). In the top plots, the dashed black line corresponds to 〈log β〉 = 0, which is the critical value. Above this value, the gas is thermally dominated, while below it, it is magnetically dominated. For the bottom plots, circles represent the thermal energy, and triangles correspond to the magnetic energy. The dashed red line represents the onset of star formation. The shaded regions correspond to the standard deviation.
Current usage metrics show cumulative count of Article Views (full-text article views including HTML views, PDF and ePub downloads, according to the available data) and Abstracts Views on Vision4Press platform.
Data correspond to usage on the plateform after 2015. The current usage metrics is available 48-96 hours after online publication and is updated daily on week days.
Initial download of the metrics may take a while.