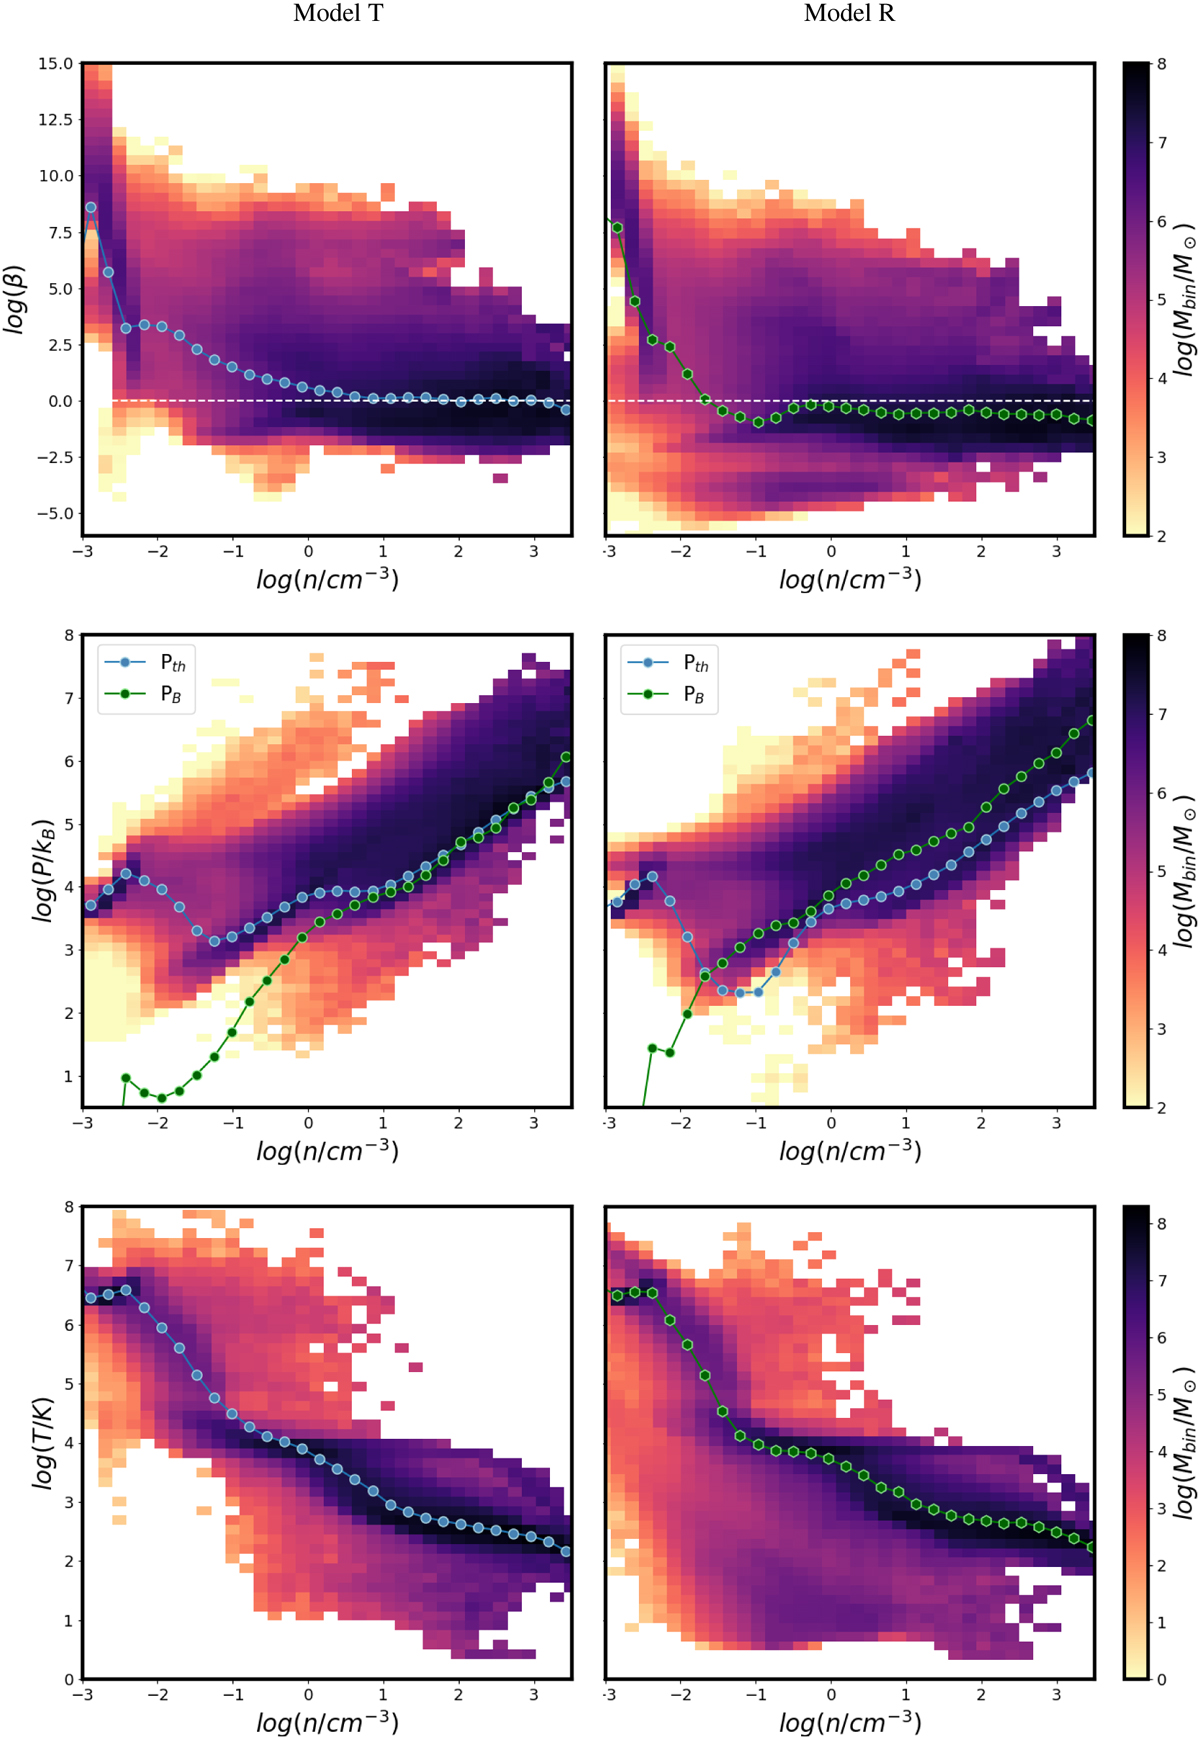
Fig. 5
Download original image
2D mass-weighted histograms of the logarithm of the plasma beta (β; top), total pressure (P; middle), and temperature (T; bottom) of the gas plotted against its density (n) for model T (left) and model R (right) at t = 500 Myr. The dots represent the mean values per density bin. The dashed white line in the top panel indicates the equipartition of thermal and magnetic pressure.
Current usage metrics show cumulative count of Article Views (full-text article views including HTML views, PDF and ePub downloads, according to the available data) and Abstracts Views on Vision4Press platform.
Data correspond to usage on the plateform after 2015. The current usage metrics is available 48-96 hours after online publication and is updated daily on week days.
Initial download of the metrics may take a while.