Fig. 3.
Download original image
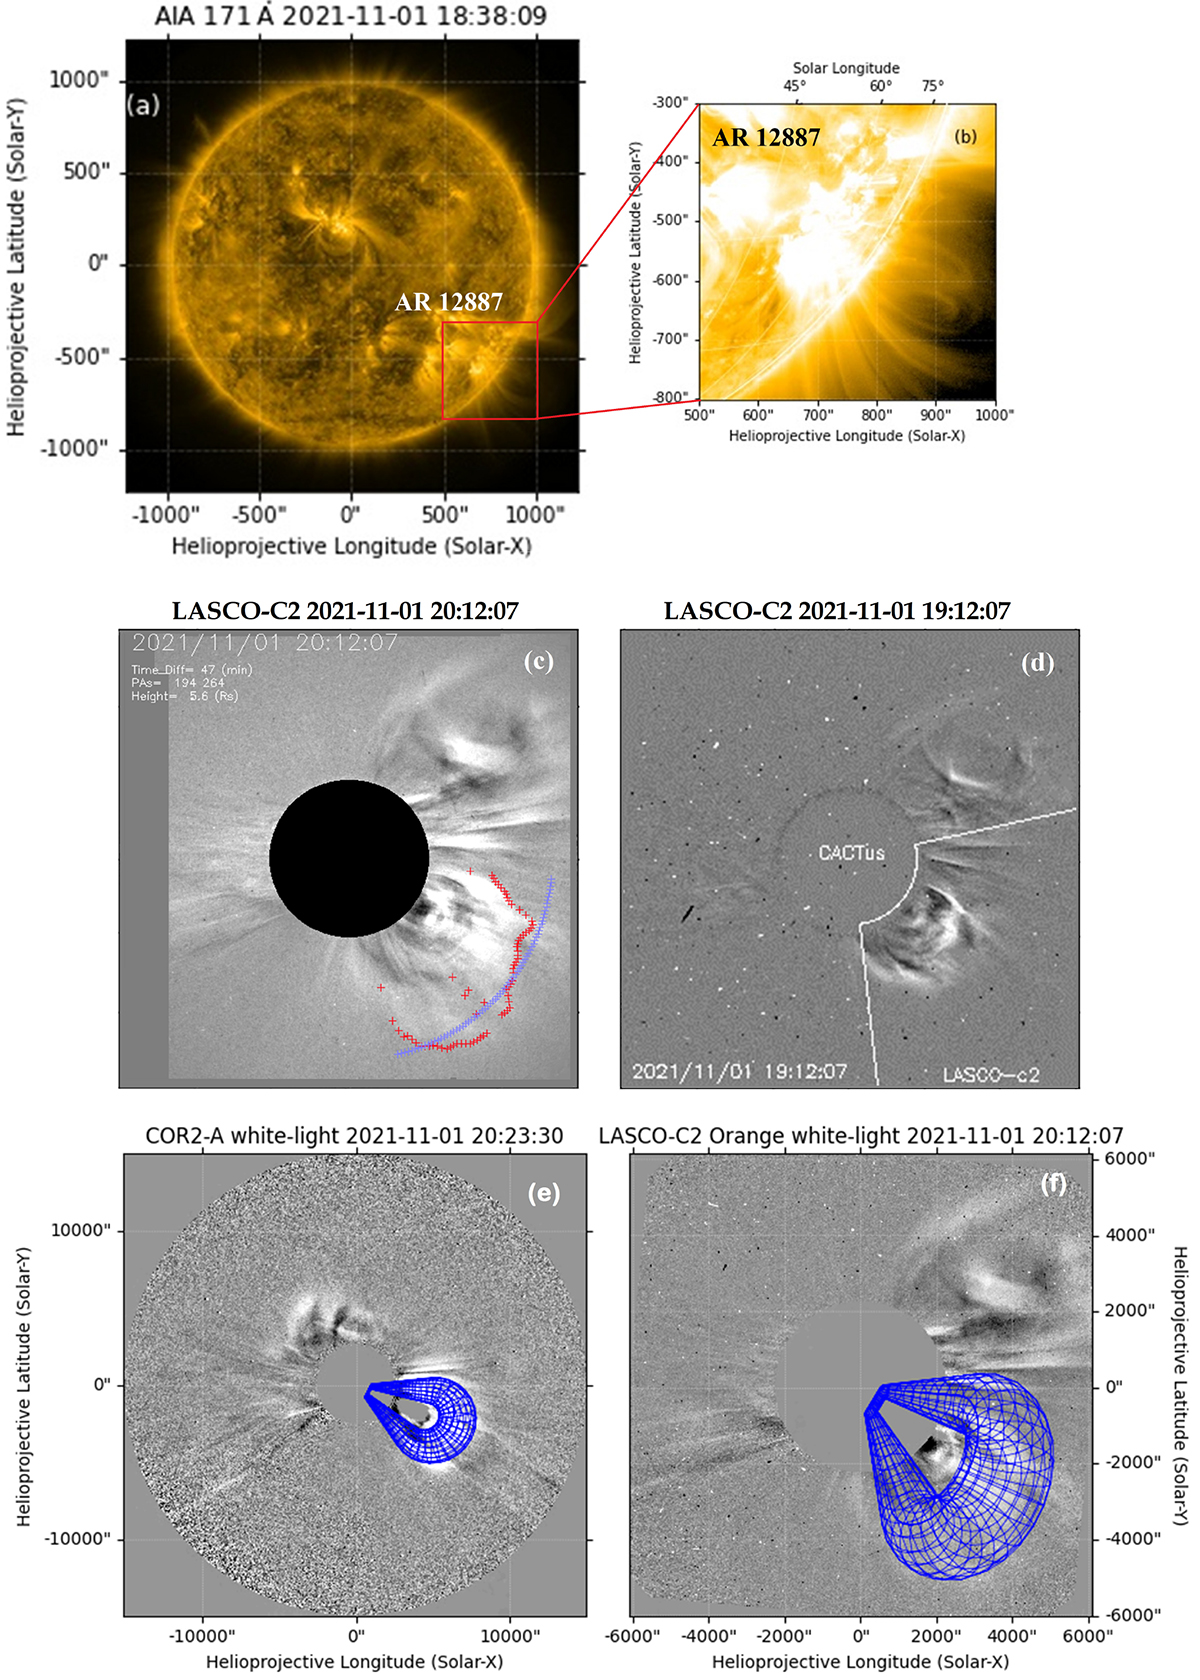
Observations associated with CME-1. (a) SDO/AIA 171 Å filter image of source active region of CME-1 on 01 Nov. 2021 18:38 UT, and zoom snap of AR 12887, showing the flux rope orientation of source region. (c) Running-difference C2 images, the blue color indicates the boundary of the leading edge of CME and red color on the difference image shows an position of leading edge (approximated) obtained using segmentation technique. (d) Running difference images of C2 indicates the direction and width of CME using CACtus. (e) and (f) Corresponding GCS modeling (blue grids) from STEREO-A and LASCO respectively, detectors and times are given in the images.
Current usage metrics show cumulative count of Article Views (full-text article views including HTML views, PDF and ePub downloads, according to the available data) and Abstracts Views on Vision4Press platform.
Data correspond to usage on the plateform after 2015. The current usage metrics is available 48-96 hours after online publication and is updated daily on week days.
Initial download of the metrics may take a while.