Open Access
Fig. 7
Download original image
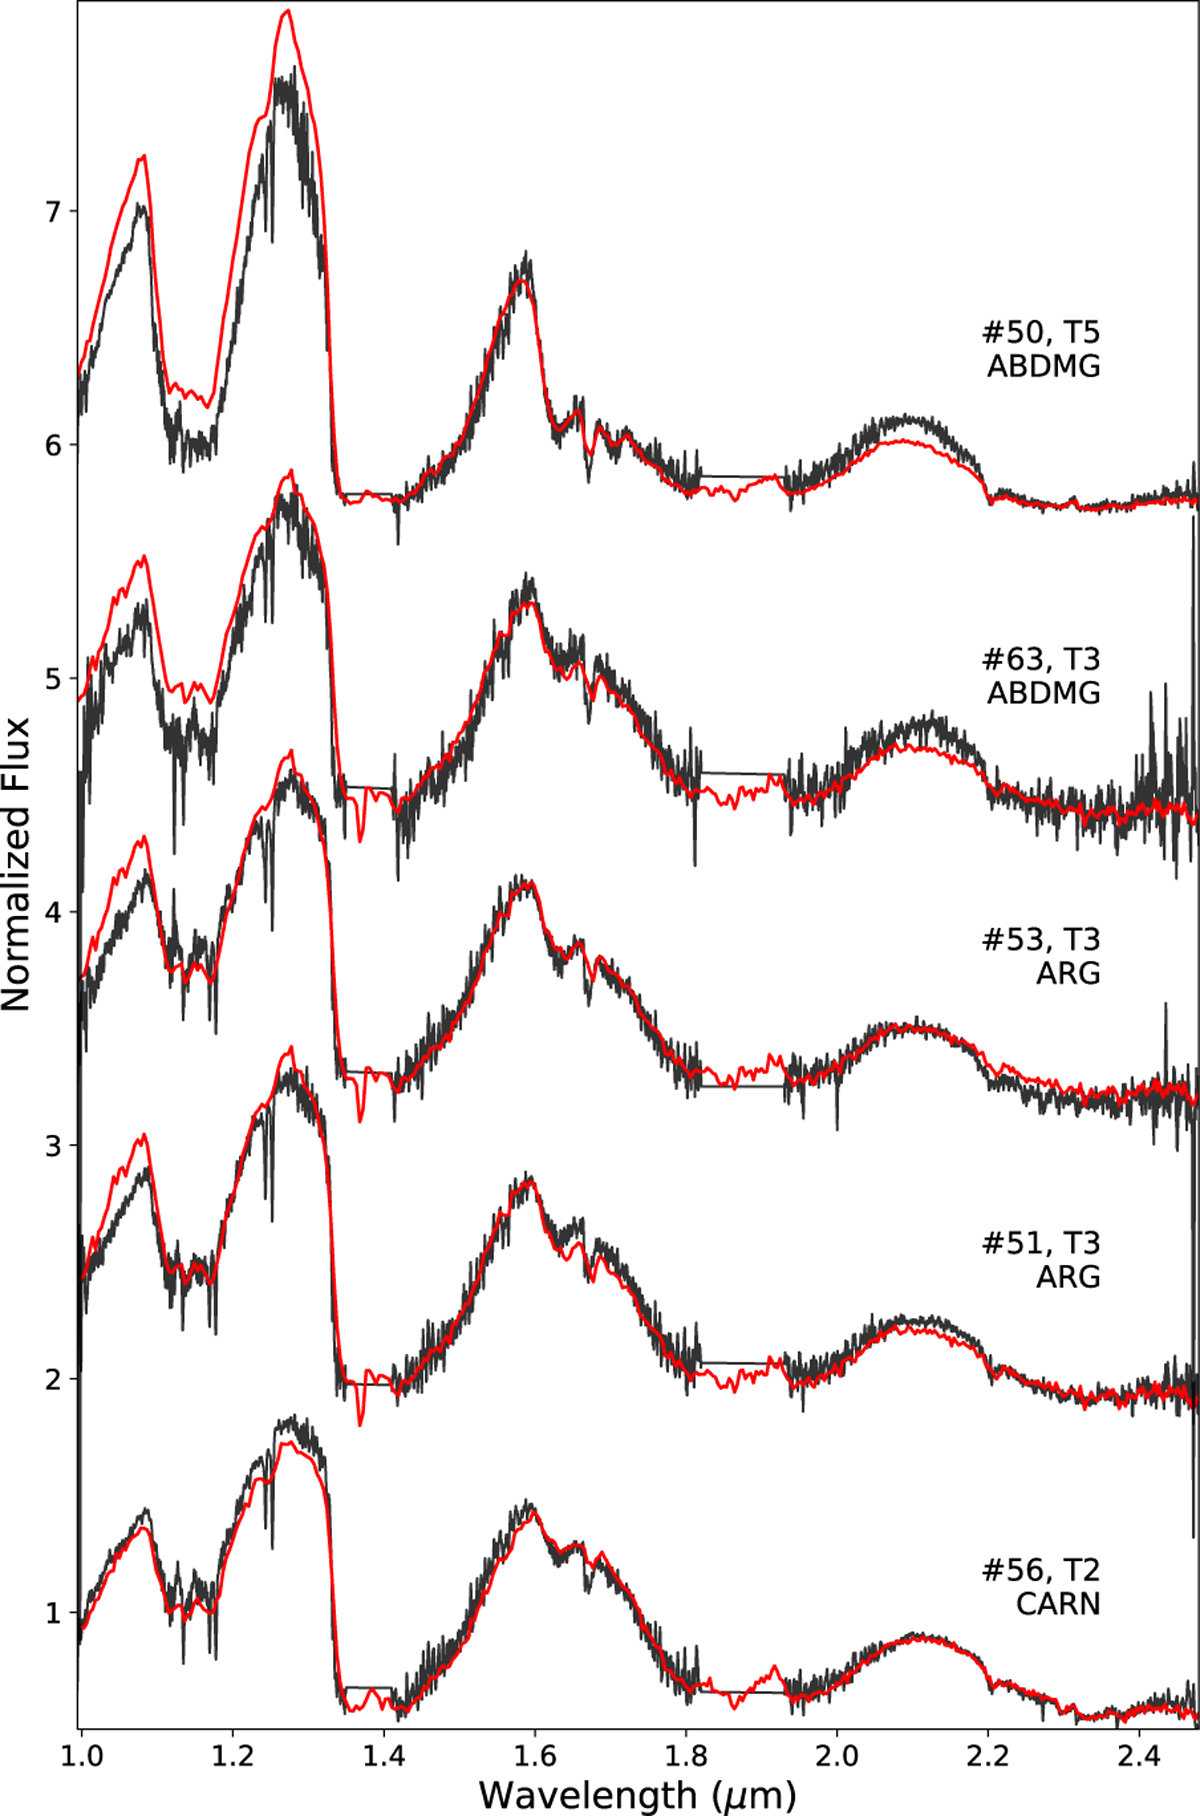
Spectra of objects classified as T-type dwarfs along with their best-fit template (in red). The ID, derived SpT, and region of each object are shown next to the corresponding spectrum. All the spectra are normalized at 1.57 μηι. An offset between the spectra was added for clarity.
Current usage metrics show cumulative count of Article Views (full-text article views including HTML views, PDF and ePub downloads, according to the available data) and Abstracts Views on Vision4Press platform.
Data correspond to usage on the plateform after 2015. The current usage metrics is available 48-96 hours after online publication and is updated daily on week days.
Initial download of the metrics may take a while.