Fig. 2
Download original image
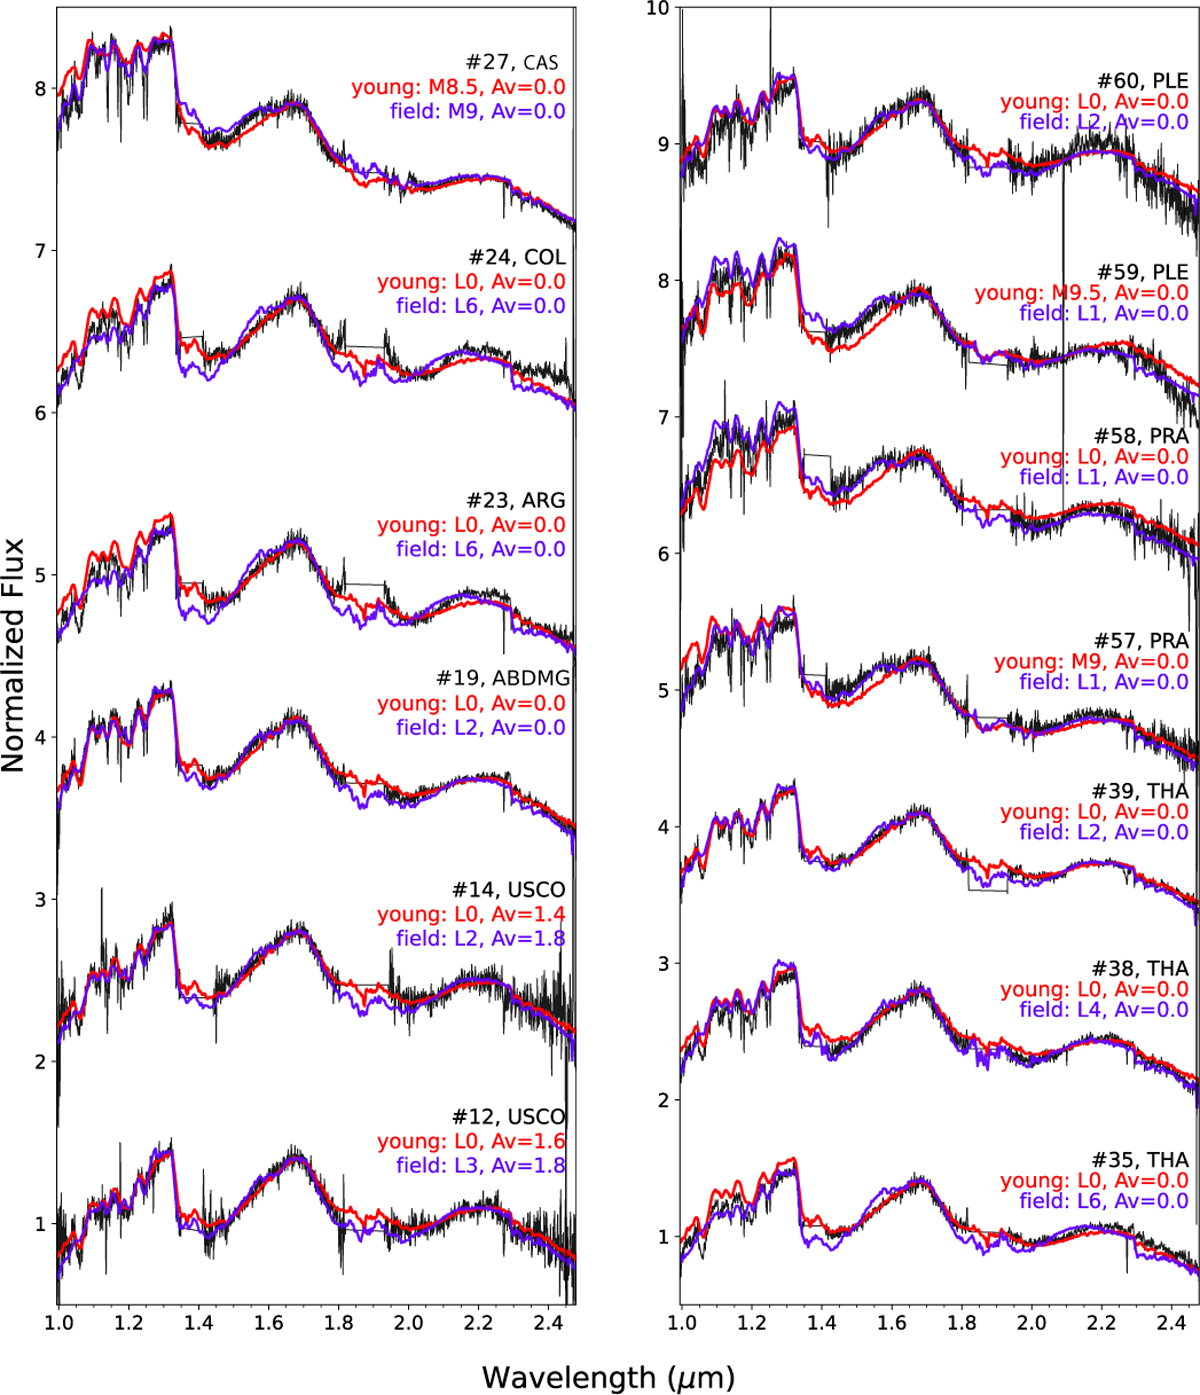
Comparison between the best-fit young (red) and field (purple) templates for dwarfs where the spectral classification made via a direct comparison with templates yields a result of an M or L field. The ID and young association are shown above the correspondent spectrum (in black). All spectra are normalized at 1.67 μm. An offset between the spectra was added for clarity.
Current usage metrics show cumulative count of Article Views (full-text article views including HTML views, PDF and ePub downloads, according to the available data) and Abstracts Views on Vision4Press platform.
Data correspond to usage on the plateform after 2015. The current usage metrics is available 48-96 hours after online publication and is updated daily on week days.
Initial download of the metrics may take a while.