Fig. 15
Download original image
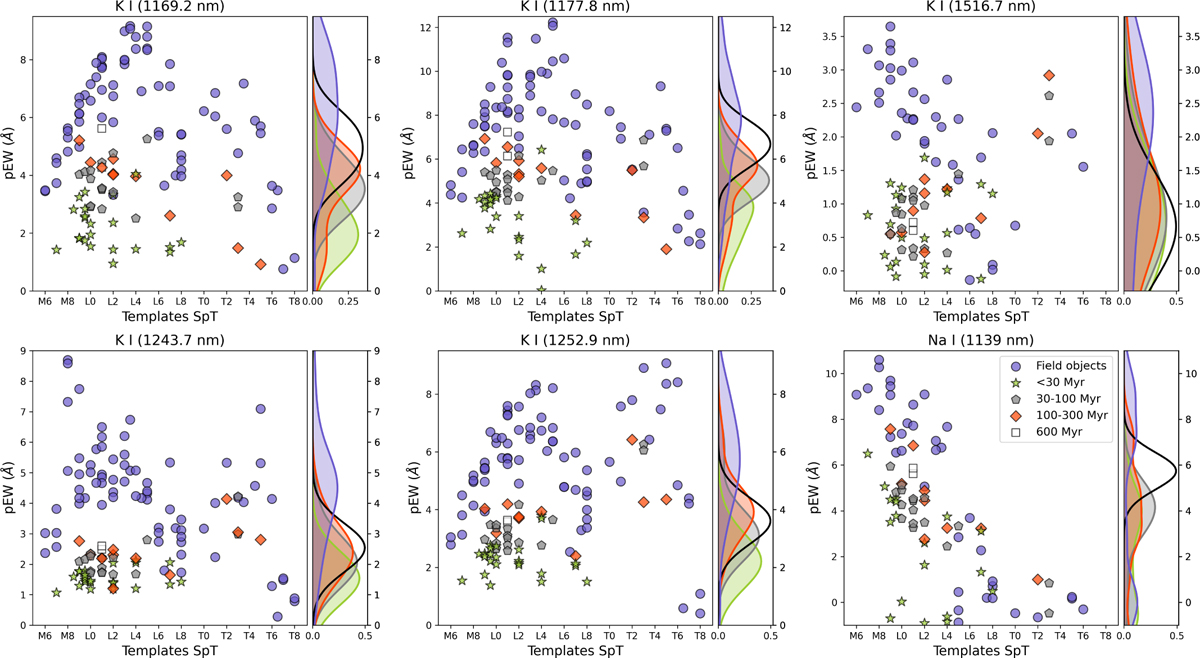
Pseudo-equivalent widths of the alkali lines in the J-band as a function of the SpT derived in Sect. 4.1. The sample is divided according to the age classes defined in Sect. 2.1. The color and marker scheme for our sample is the same as Fig. 14. The purple circles are field objects from McLean et al. (2003) and Cushing et al. (2005). In the right panels of each sub-figure, there are the KDE for each age class (color-coded accordingly).
Current usage metrics show cumulative count of Article Views (full-text article views including HTML views, PDF and ePub downloads, according to the available data) and Abstracts Views on Vision4Press platform.
Data correspond to usage on the plateform after 2015. The current usage metrics is available 48-96 hours after online publication and is updated daily on week days.
Initial download of the metrics may take a while.