Fig. 13
Download original image
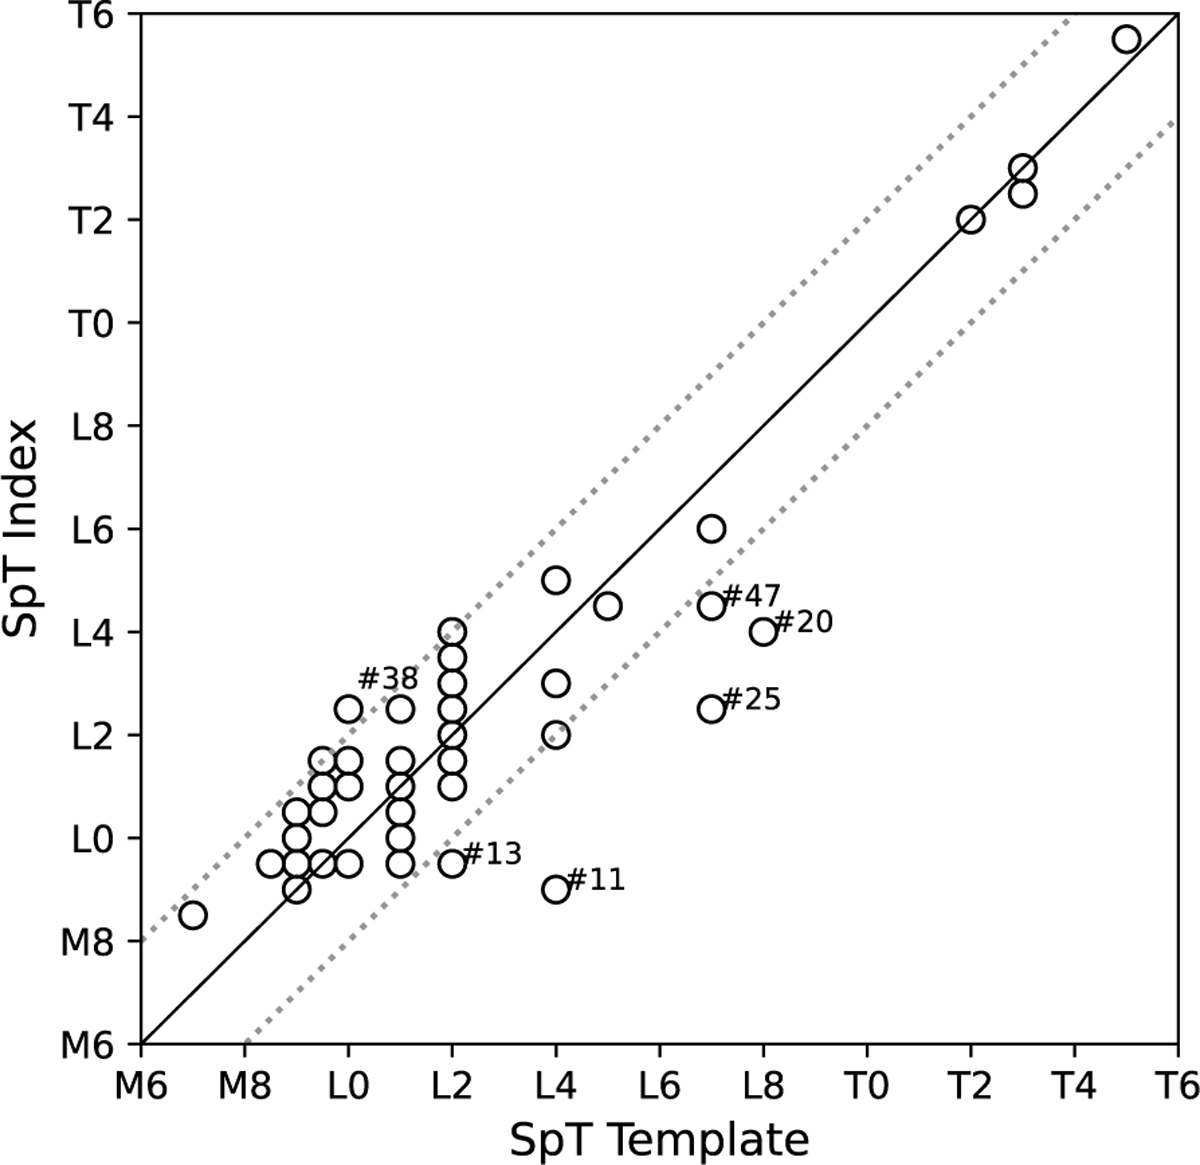
Comparison between the derived NIR SpT using spectral indices (see Sect. 4.3) and the SpT derived via a direct comparison with spectral templates (see Sect. 4.1). The solid black line indicates perfect agreement between classifications. The dotted black lines represent the ±2 sub-SpT range. The ID of the objects for which their classifications do not agree within ±2 sub-SpTs is shown.
Current usage metrics show cumulative count of Article Views (full-text article views including HTML views, PDF and ePub downloads, according to the available data) and Abstracts Views on Vision4Press platform.
Data correspond to usage on the plateform after 2015. The current usage metrics is available 48-96 hours after online publication and is updated daily on week days.
Initial download of the metrics may take a while.