Fig. 1
Download original image
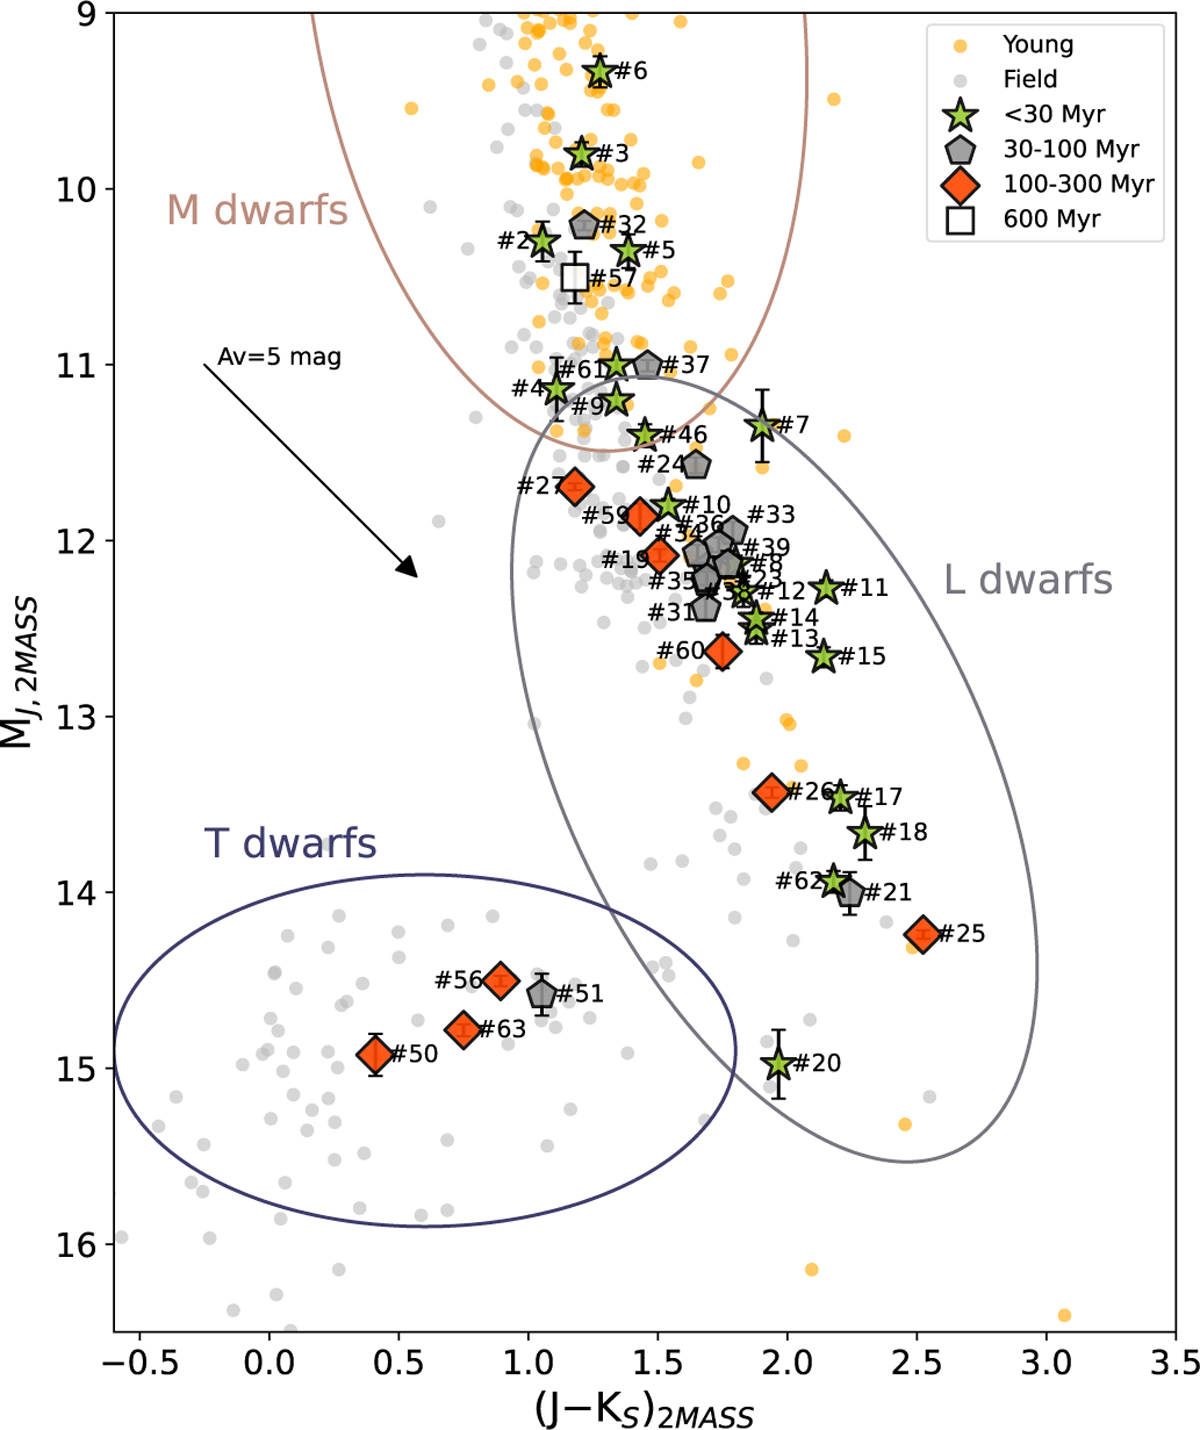
(MJ, J–KS) color-absolute magnitude diagram of our objects, very low-gravity objects (orange circles), and field objects (gray circles) from the literature (AA22; Database of Ultracool Parallaxes). Our sample is divided according to the age of the association to which the objects probably belong. Green stars represent objects in regions with ages <30 Myr, dark gray pentagons with ages between 30 and 100 Myr (included), red diamonds with ages between 100 and 300 Myr (included), and white squares with ages ~600 Myr. For data points where the error bar is not visible, the bar is smaller than the marker size. The three ellipses approximately highlight where the M, L, and T dwarfs are located in this diagram. The arrow indicates what effect the addition of five magnitudes of extinction would have.
Current usage metrics show cumulative count of Article Views (full-text article views including HTML views, PDF and ePub downloads, according to the available data) and Abstracts Views on Vision4Press platform.
Data correspond to usage on the plateform after 2015. The current usage metrics is available 48-96 hours after online publication and is updated daily on week days.
Initial download of the metrics may take a while.