Fig. 7
Download original image
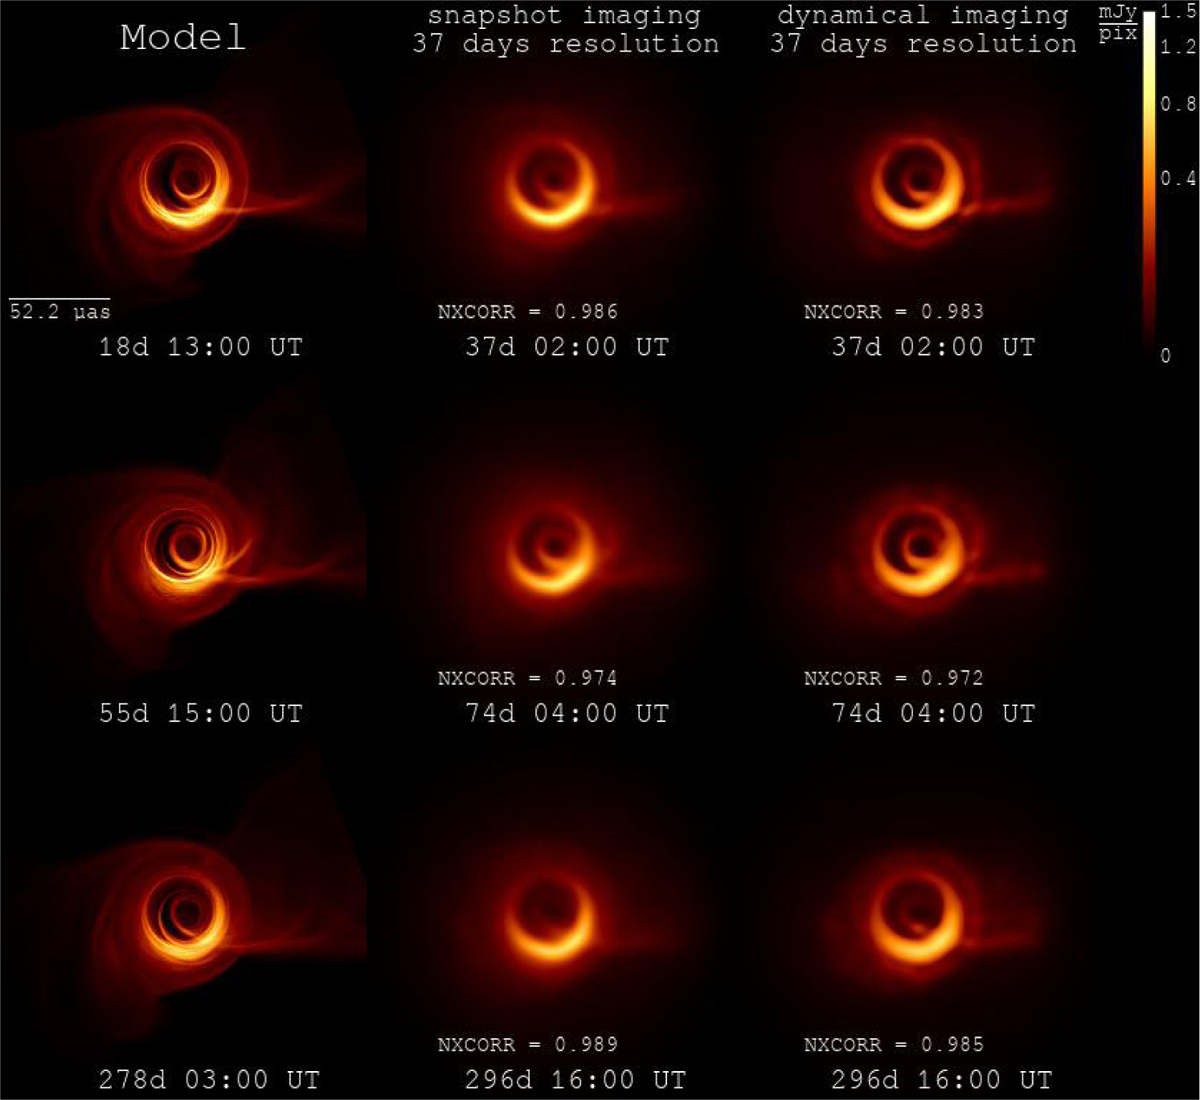
Reconstruction of a simulated M87* shadow observation with the EHI at 230 GHz for 400 km orbital separation. From left to right: the middle theoretical emission map in the period of 37 days (the model with 3.7 days between frames); frames of the simulated movies, each lasting 37 days, reconstructed using snapshot imaging and dynamical imaging methods. For the EHI observing at 230 GHz, these movies demonstrate the best quality, according to the NXCORR, among all reconstructions that image source dynamics. The source is varying during the simulated observation. Colours indicate brightness/pixel in mJy (square root scale). The full reconstruction is available as an online movie.
Current usage metrics show cumulative count of Article Views (full-text article views including HTML views, PDF and ePub downloads, according to the available data) and Abstracts Views on Vision4Press platform.
Data correspond to usage on the plateform after 2015. The current usage metrics is available 48-96 hours after online publication and is updated daily on week days.
Initial download of the metrics may take a while.