Fig. 1
Download original image
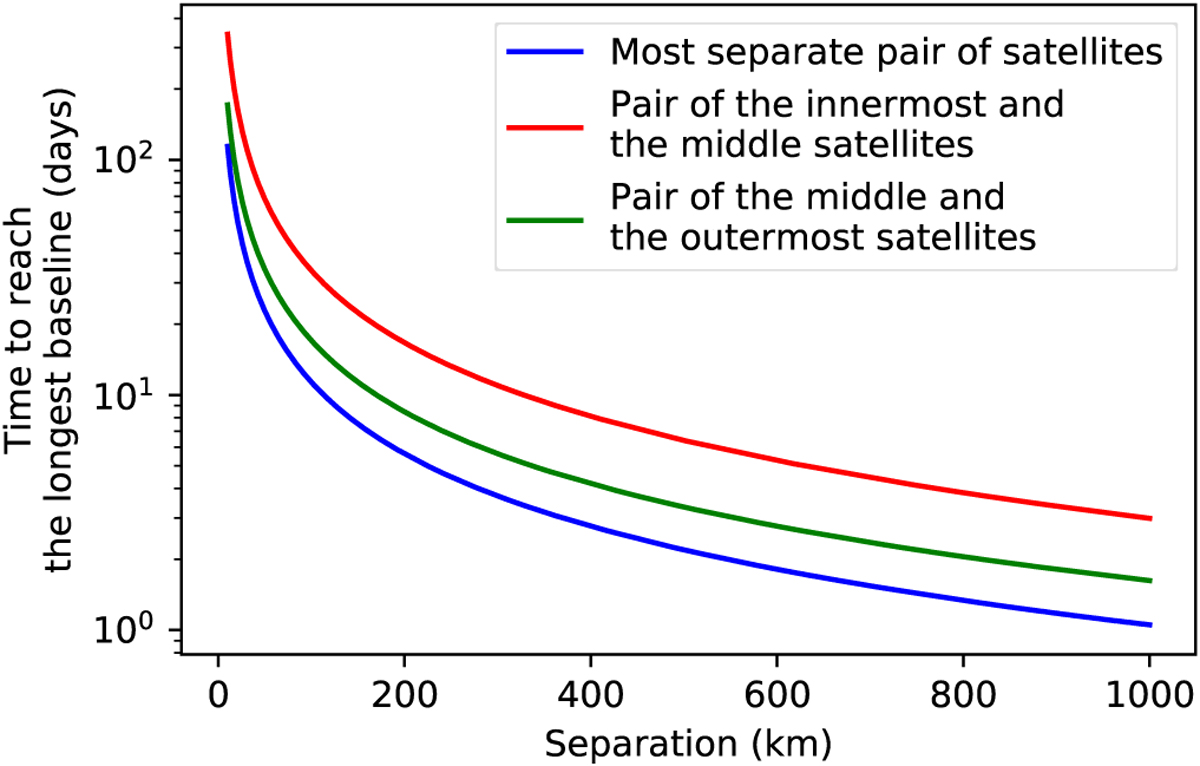
Time to reach the longest baseline as a function of orbital separation for the considered EHI system setup. Blue line corresponds to the most separate pair of satellites; red line corresponds to the pair of the innermost and the middle satellites; green line corresponds to the pair of the middle and the outermost satellites.
Current usage metrics show cumulative count of Article Views (full-text article views including HTML views, PDF and ePub downloads, according to the available data) and Abstracts Views on Vision4Press platform.
Data correspond to usage on the plateform after 2015. The current usage metrics is available 48-96 hours after online publication and is updated daily on week days.
Initial download of the metrics may take a while.