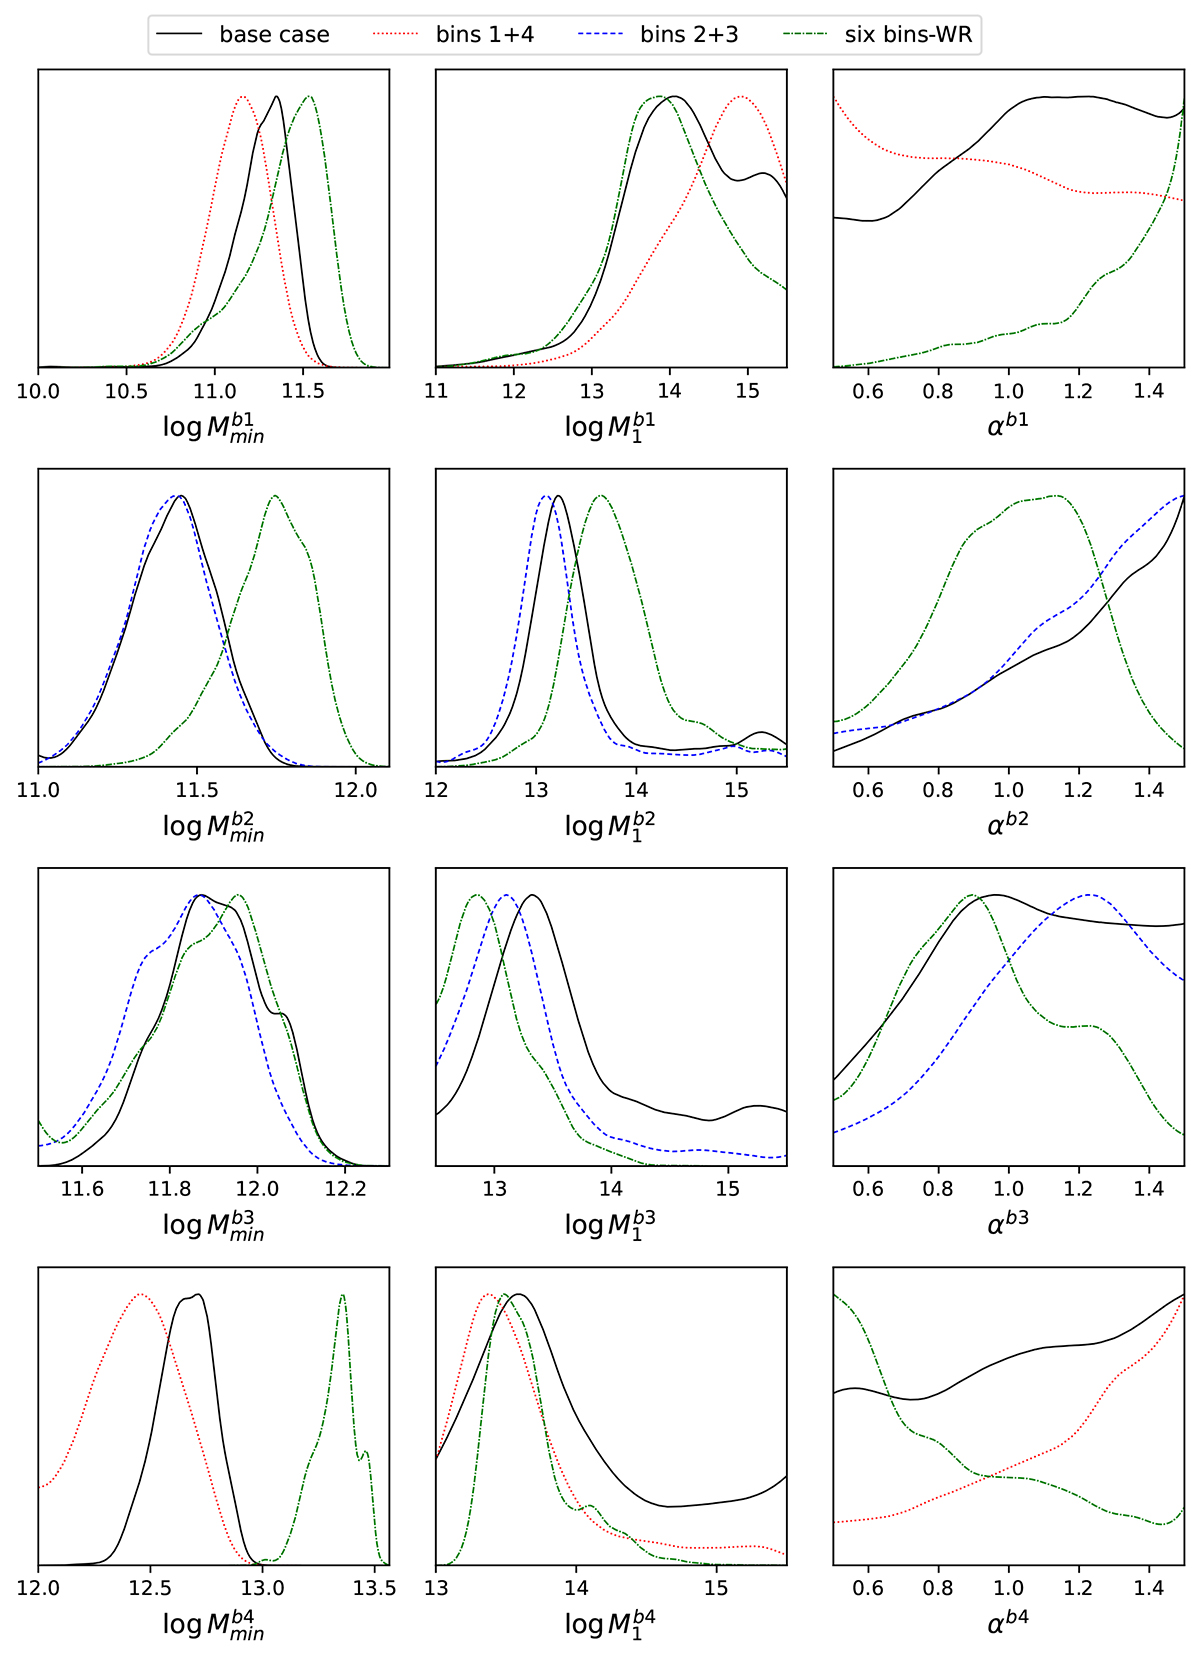
Fig. 8.
Download original image
Comparison of the marginalised posterior distributions of the HOD parameters (log Mmin, log M1 and α from left to right, respectively) derived in the different analysed cases, for bin 1, bin 2, bin 3, and bin 4, respectively (from top to bottom). The “base case” is shown with the black solid line, “bins 1+4” with the red dotted line, “bins 2+3” with the blue dashed line and the “six bins-WR” with the green dash-dotted line. The mass values are expressed in M⊙ h−1 units.
Current usage metrics show cumulative count of Article Views (full-text article views including HTML views, PDF and ePub downloads, according to the available data) and Abstracts Views on Vision4Press platform.
Data correspond to usage on the plateform after 2015. The current usage metrics is available 48-96 hours after online publication and is updated daily on week days.
Initial download of the metrics may take a while.