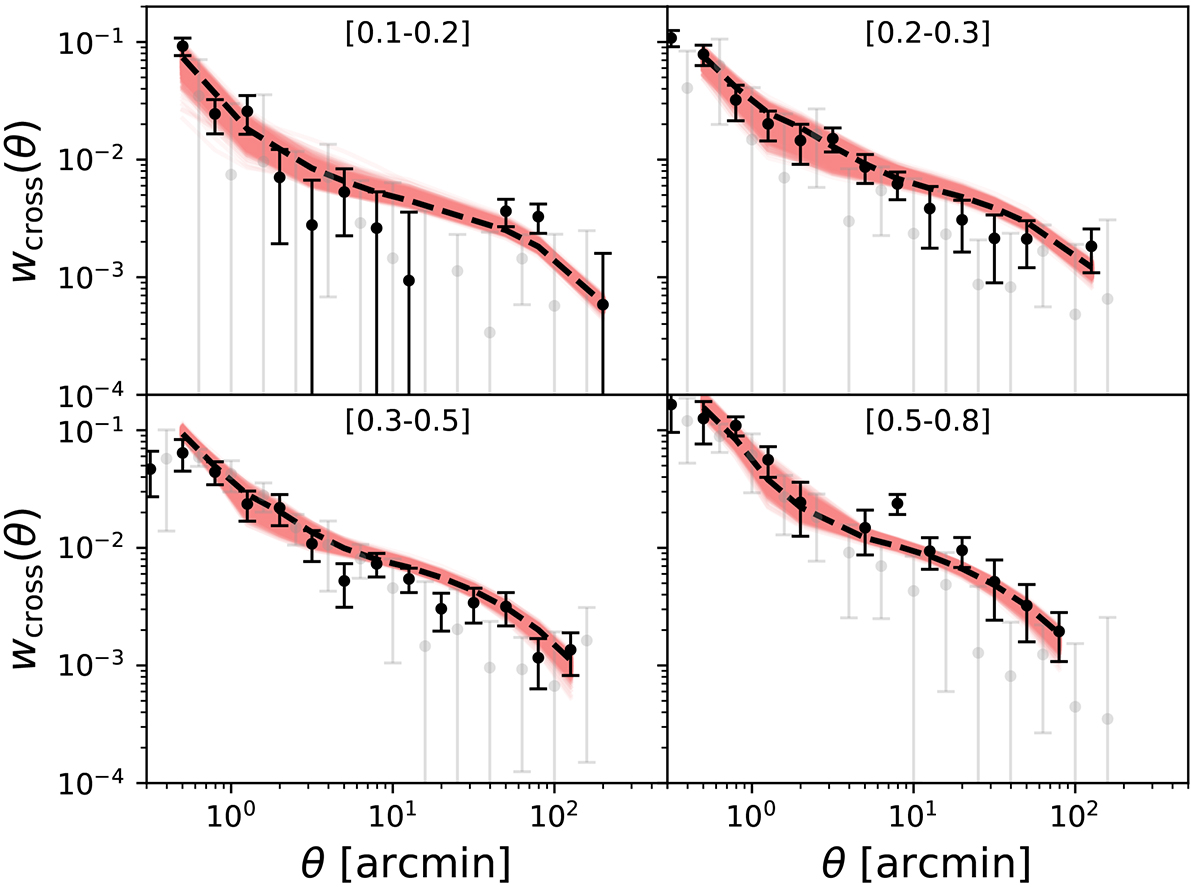
Fig. 2.
Download original image
Cross-correlation data (black points) and the results obtained with the tomographic case: the posterior sampling of the cross-correlation function is shown in red and the best fit with the black dashed line. Bins 1 to 4 are shown from left to right and top to bottom. For comparison, the cross-correlation data by Bonavera et al. (2021) are shown in grey.
Current usage metrics show cumulative count of Article Views (full-text article views including HTML views, PDF and ePub downloads, according to the available data) and Abstracts Views on Vision4Press platform.
Data correspond to usage on the plateform after 2015. The current usage metrics is available 48-96 hours after online publication and is updated daily on week days.
Initial download of the metrics may take a while.