Fig. 7.
Download original image
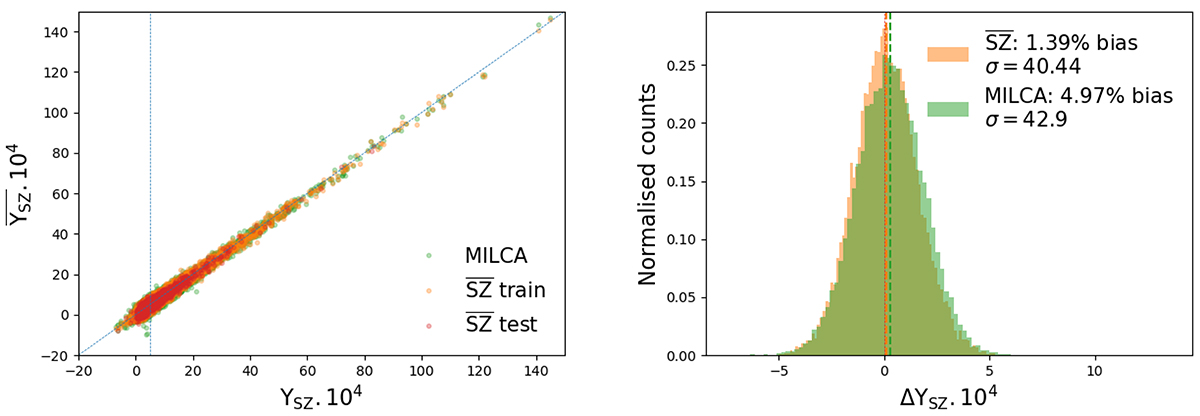
Comparison of the SZ fluxes computed with aperture photometry in the exact same way in the SZ WebSky map, in the ![]() map, and in the MILCA SZ map. Left: fluxes on the reconstructed maps as a function of the SZ WebSky fluxes. The blue dashed line represents the SZ flux have been enhanced in the weight map w. Right: histograms of the residuals. The dashed lines show the median values of the distributions.
map, and in the MILCA SZ map. Left: fluxes on the reconstructed maps as a function of the SZ WebSky fluxes. The blue dashed line represents the SZ flux have been enhanced in the weight map w. Right: histograms of the residuals. The dashed lines show the median values of the distributions.
Current usage metrics show cumulative count of Article Views (full-text article views including HTML views, PDF and ePub downloads, according to the available data) and Abstracts Views on Vision4Press platform.
Data correspond to usage on the plateform after 2015. The current usage metrics is available 48-96 hours after online publication and is updated daily on week days.
Initial download of the metrics may take a while.