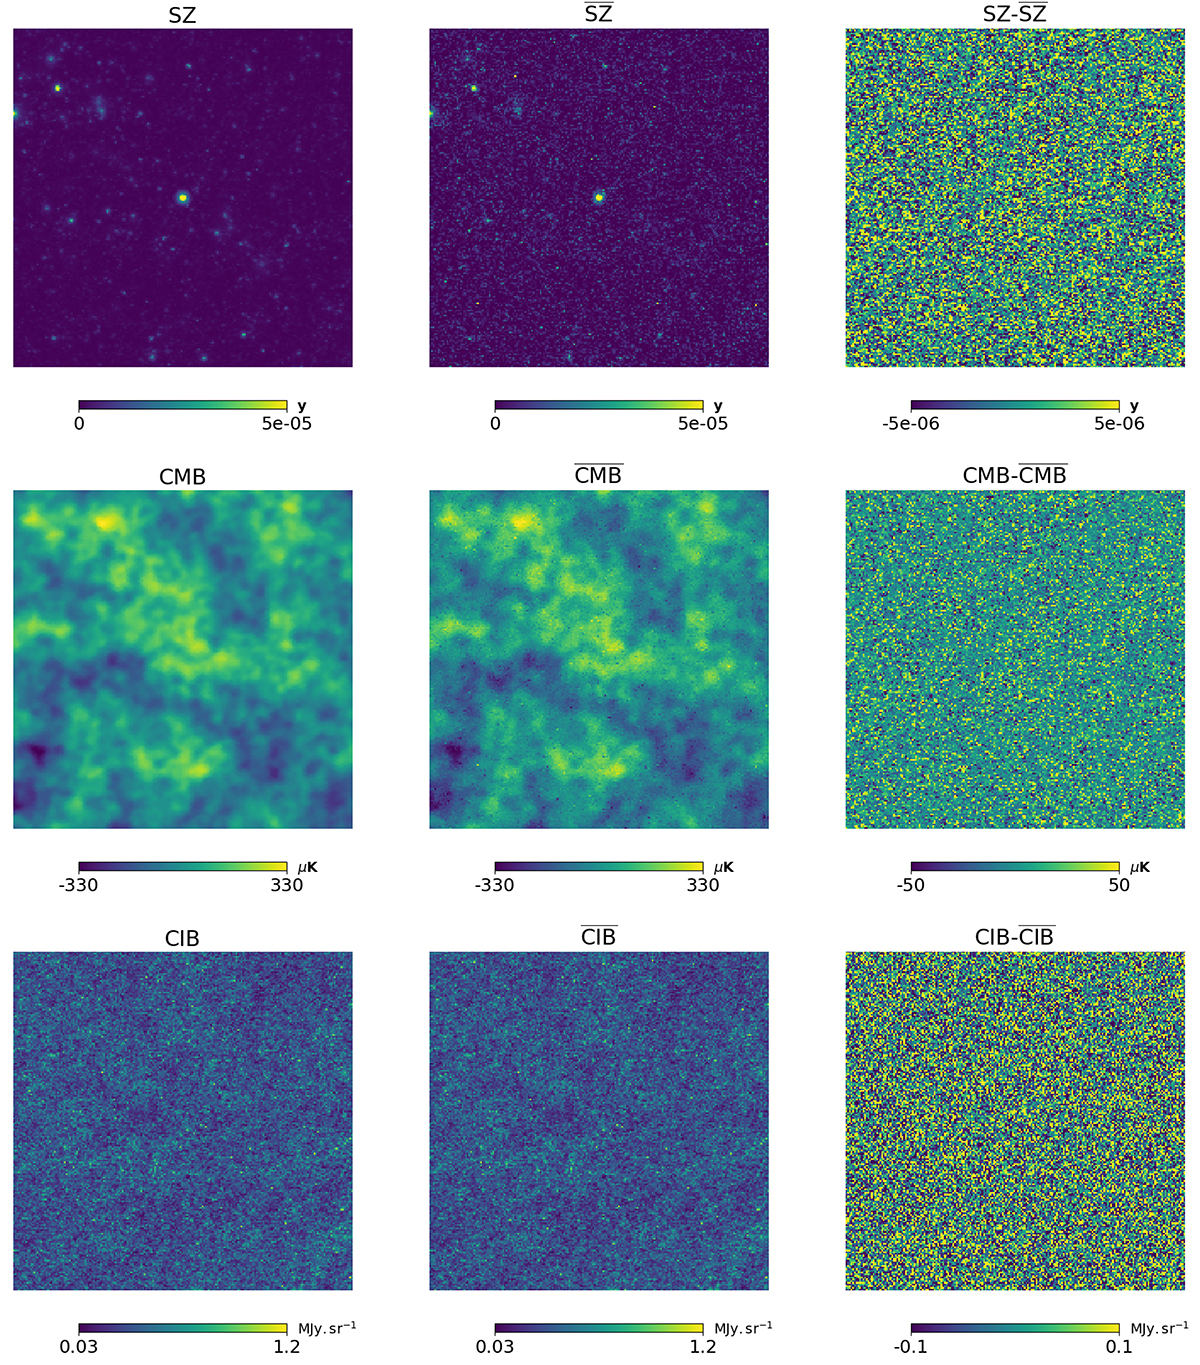
Fig. 3.
Download original image
Projection in a 5° ×5° patch of the HEALPIX maps of the different components around the brightest SZ cluster. Left column: from top to bottom, the SZ, CMB, and CIB from WebSky simulation maps. Middle column: from top to bottom, the reconstructed ![]() ,
, ![]() , and
, and ![]() . Right column: residuals between the WebSky component and the reconstructed ones. Very good agreement is seen visually between the reconstructed maps and the expected map, without structures in the residuals.
. Right column: residuals between the WebSky component and the reconstructed ones. Very good agreement is seen visually between the reconstructed maps and the expected map, without structures in the residuals.
Current usage metrics show cumulative count of Article Views (full-text article views including HTML views, PDF and ePub downloads, according to the available data) and Abstracts Views on Vision4Press platform.
Data correspond to usage on the plateform after 2015. The current usage metrics is available 48-96 hours after online publication and is updated daily on week days.
Initial download of the metrics may take a while.