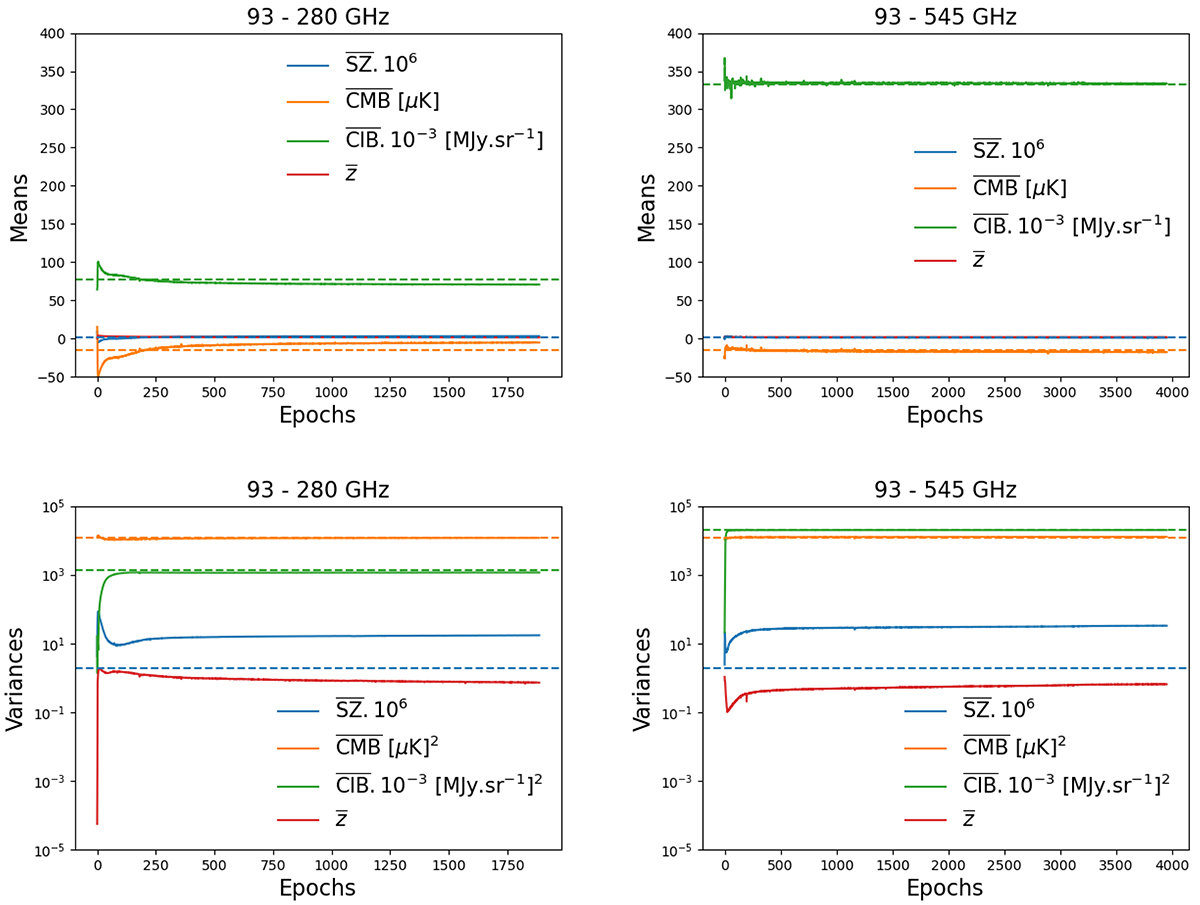
Fig. 2.
Download original image
Evolution of the different statistical quantities of the extracted components in the unseen area of the sky. Top: evolution of the means of the components on the left for the seven-frequency configuration and on the right for the nine-frequency configuration. Bottom: evolution of the variances of the components on the left for the seven-frequency configuration and on the right for the nine-frequency configuration. Dashed lines represent the expected values. The values for the CIB are not the same for the seven and the nine frequencies models, as we are computing the CIB at 280 GHz for the first case and the CIB at 545 GHz for the second case. Units are different for each map: ![]() and
and ![]() are without units (y and redshift),
are without units (y and redshift), ![]() is in μK, and
is in μK, and ![]() is in MJy sr−1.
is in MJy sr−1.
Current usage metrics show cumulative count of Article Views (full-text article views including HTML views, PDF and ePub downloads, according to the available data) and Abstracts Views on Vision4Press platform.
Data correspond to usage on the plateform after 2015. The current usage metrics is available 48-96 hours after online publication and is updated daily on week days.
Initial download of the metrics may take a while.