Fig. 7.
Download original image
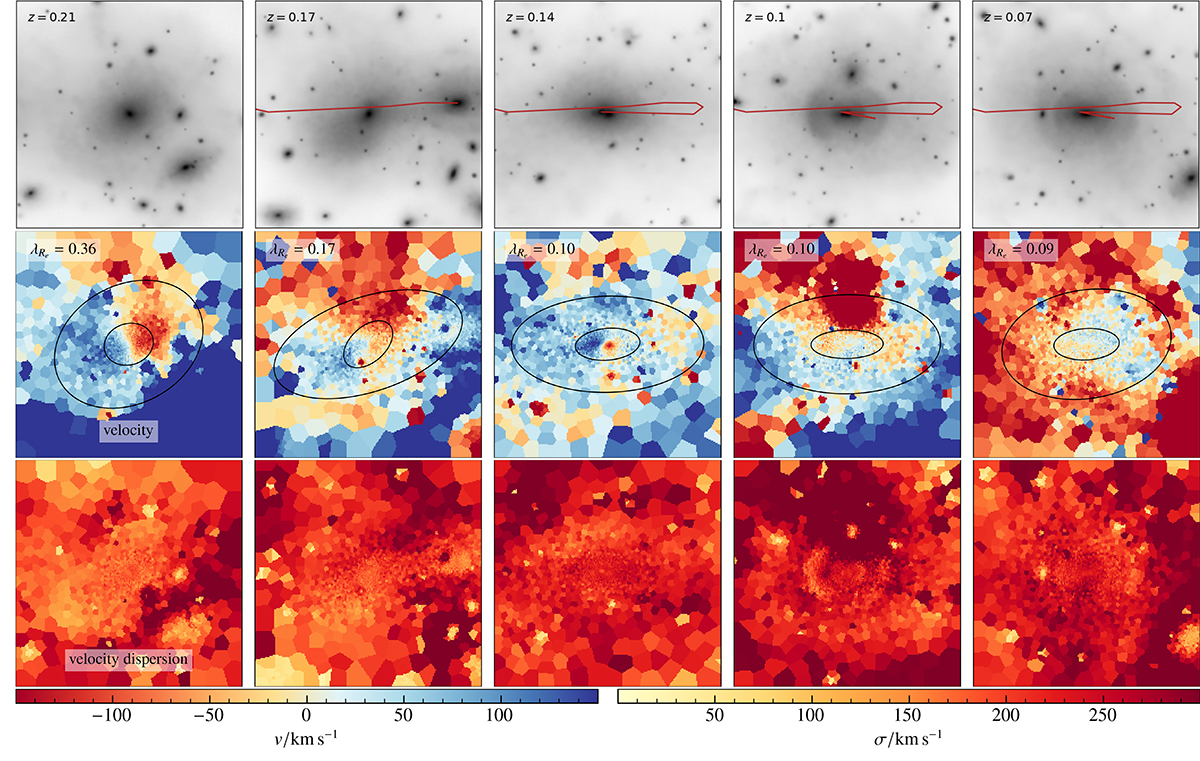
Evolution of the first example galaxy from Fig. 1. The shells develop after a massive radial merger event, which also causes the value of λRe to sharply drop and converts the galaxy into a slow rotator (where λRe is measured from the edge-on projection). Top: mock images of the stellar component from a projection in which the shells are especially clearly visible. The red lines trace the orbit of the infalling galaxy until the respective point in time. Middle: velocity maps. The circles indicate the ellipses at one and three half-mass radii. Bottom: velocity dispersion maps.
Current usage metrics show cumulative count of Article Views (full-text article views including HTML views, PDF and ePub downloads, according to the available data) and Abstracts Views on Vision4Press platform.
Data correspond to usage on the plateform after 2015. The current usage metrics is available 48-96 hours after online publication and is updated daily on week days.
Initial download of the metrics may take a while.