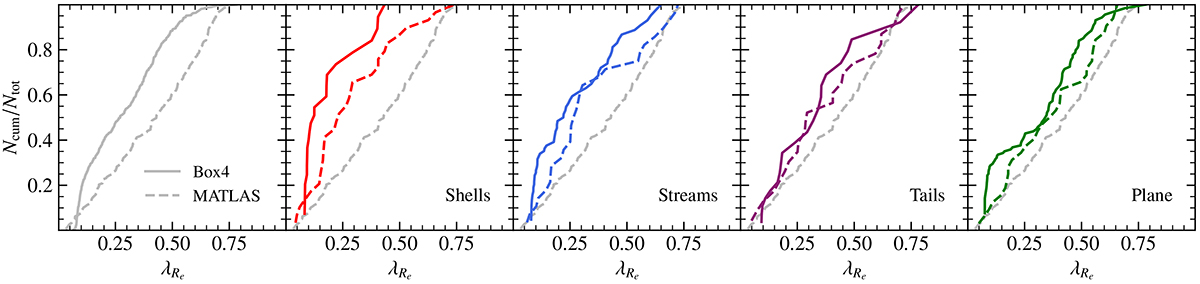
Fig. 6.
Download original image
Cumulative histograms of λRe for the galaxies in the MATLAS survey (dashed lines) and in Magneticum Box4 (uhr) (solid lines). Only the ETGs and intermediate-type galaxies were considered for the simulated sample. The first plot shows the difference in the distributions between observations and simulations. The cumulative histograms of the simulated galaxies in the other four panels were adapted to match the parent distribution of MATLAS to be directly comparable to the distributions of the MATLAS survey. The colored lines lying above the dashed gray line (the overall distribution of the MATLAS survey) indicate an increased presence of the respective tidal feature or satellite plane for galaxies with lower rotational support compared to those with higher rotational support. The measurements of shells, streams, and tails of MATLAS galaxies are taken from Bílek et al. (2020), and the measurements of the planes are taken from Heesters et al. (2021).
Current usage metrics show cumulative count of Article Views (full-text article views including HTML views, PDF and ePub downloads, according to the available data) and Abstracts Views on Vision4Press platform.
Data correspond to usage on the plateform after 2015. The current usage metrics is available 48-96 hours after online publication and is updated daily on week days.
Initial download of the metrics may take a while.