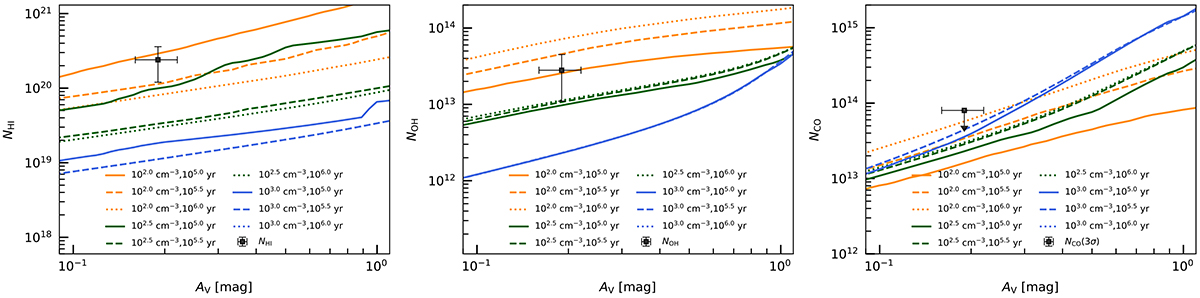
Fig. D.1.
Download original image
Modeling results of NHI, NOH, and NCO under different physical parameters (from left to right, respectively). The orange, green, and blue curves represent the evolution timescale t = 105, 105.5, and 106 yr. The solid, dashed, and dotted curves represent the gas densities nH = 102, 102.5, and 103 cm−3. The black points denote data from observations.
Current usage metrics show cumulative count of Article Views (full-text article views including HTML views, PDF and ePub downloads, according to the available data) and Abstracts Views on Vision4Press platform.
Data correspond to usage on the plateform after 2015. The current usage metrics is available 48-96 hours after online publication and is updated daily on week days.
Initial download of the metrics may take a while.