Fig. 2.
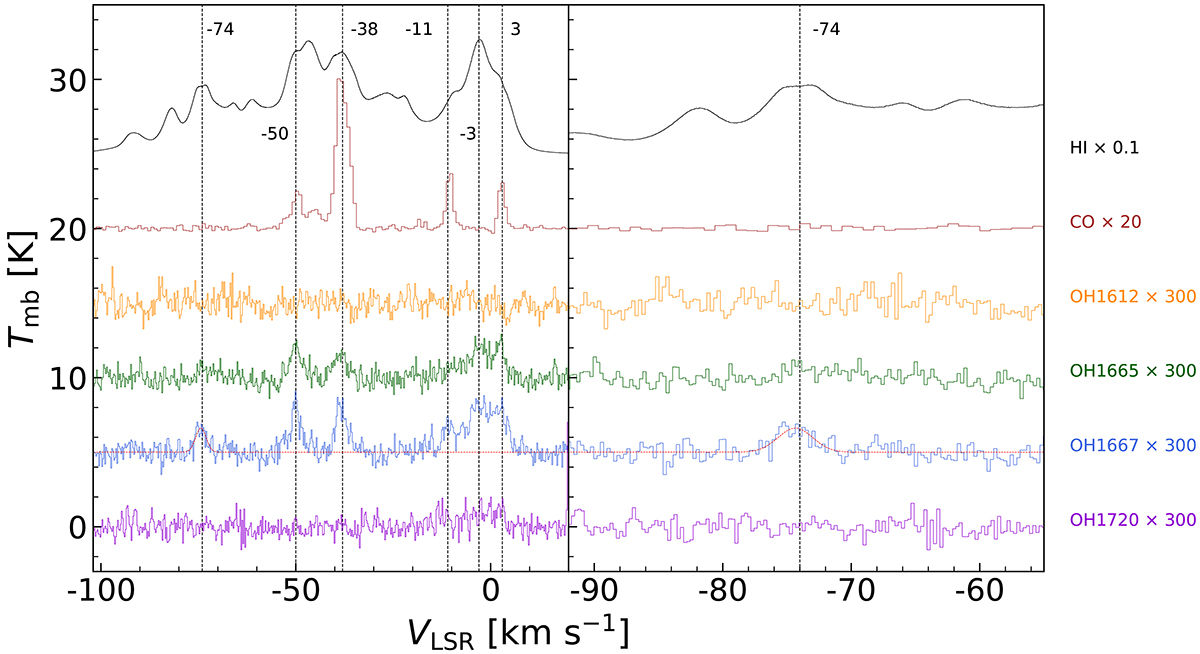
Download original image
Left: spectra of H I, CO, OH 1612, OH 1665, OH 1667, and OH 1720 MHz (from top to bottom) toward the H I arc. The x-axis and y-axis denote the velocity in km s−1 and the brightness temperature, respectively. Black dotted lines and velocity labels denote each of the velocity components in km s−1 as seen in the OH 1667 MHz emission. The scaling factor of each spectrum is listed in the right panel of this figure. To avoid overlapping, the spectra of H I, CO, and OH have been shifted upwards by multiples of 5 K on the y-axis. Right: same as in the left panel but showing a zoom onto the spectra at the −74 km s−1 component.
Current usage metrics show cumulative count of Article Views (full-text article views including HTML views, PDF and ePub downloads, according to the available data) and Abstracts Views on Vision4Press platform.
Data correspond to usage on the plateform after 2015. The current usage metrics is available 48-96 hours after online publication and is updated daily on week days.
Initial download of the metrics may take a while.