Fig. 4.
Download original image
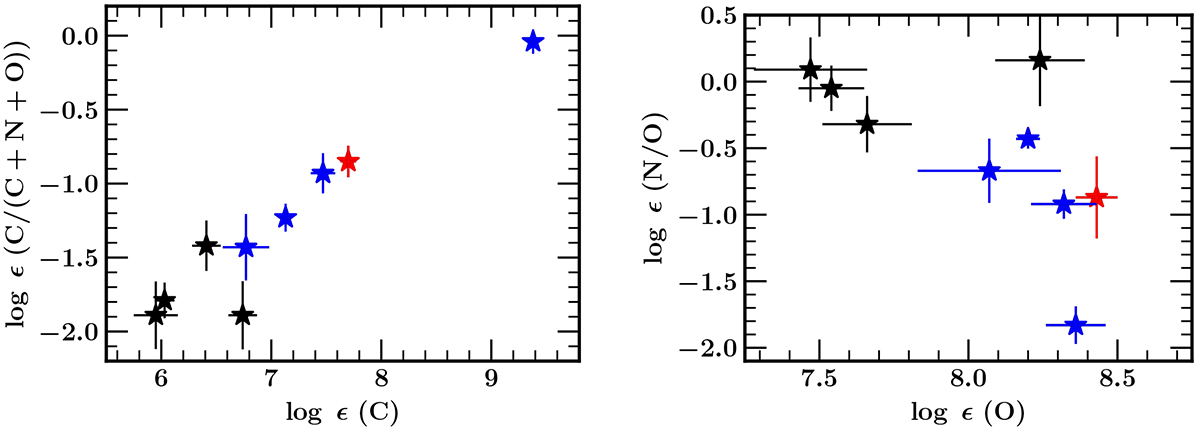
Comparison between abundance ratios of PAGB star of E3 and other GCs. PAGB stars with 3DU evidence are shown as blue asterisks; those with no 3DU evidence are shown as black asterisks. The newly identified PAGB star of E3 is shown as a red asterisk. The left panel shows C/CNO versus C abundance plot, whereas the right panel shows N/O vs. O abundance plot.
Current usage metrics show cumulative count of Article Views (full-text article views including HTML views, PDF and ePub downloads, according to the available data) and Abstracts Views on Vision4Press platform.
Data correspond to usage on the plateform after 2015. The current usage metrics is available 48-96 hours after online publication and is updated daily on week days.
Initial download of the metrics may take a while.