Fig. 2.
Download original image
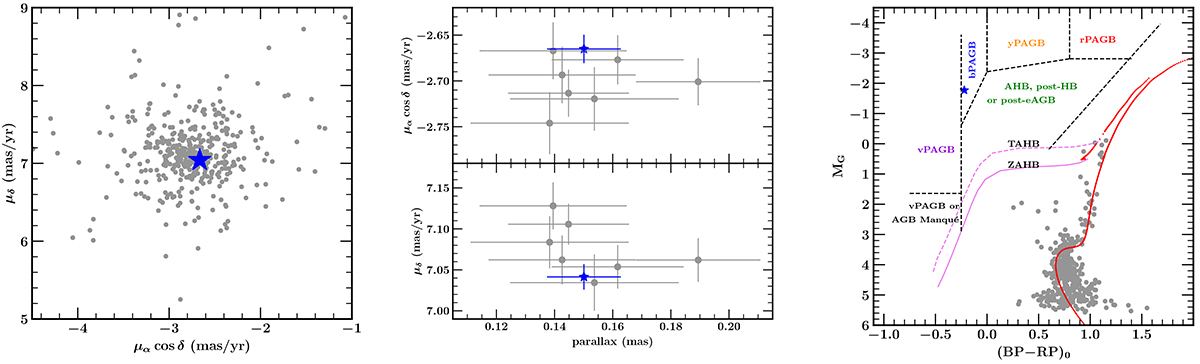
Diagrams showing the kinematics and photometric analysis of the cluster member sources with the Gaia data. The left panel shows the vector-point diagram of the cluster member sources from the Gaia catalogue (Vasiliev & Baumgardt 2021, grey dots) and the UVIT observed cluster member source (blue asterisk). The middle panel shows the parallax vs proper motion in RA (top) and Dec (bottom) for the Gaia-observed cluster members having parallax S/N (plx/e_plx) > 5 (grey dots) and the UVIT observed cluster member source (blue asterisks). The right panel shows BP−RP versus MG CMD in the absolute magnitude plane. The GaiaG magnitudes (grey dots) are scaled to absolute magnitudes using distance modulus, m − M = 14.50 (Baumgardt & Vasiliev 2021). The BaSTI-IAC isochrone of age 11 Gyr, [Fe/H] = −0.70 dex is overplotted as a red solid line. The zero-age HB (ZAHB) and terminal-age HB (TAHB) loci are shown as solid pink and dashed lines, respectively. The black dashed line shows different subcategories of PAGB and post-HB stars, as defined in Bond (2021).
Current usage metrics show cumulative count of Article Views (full-text article views including HTML views, PDF and ePub downloads, according to the available data) and Abstracts Views on Vision4Press platform.
Data correspond to usage on the plateform after 2015. The current usage metrics is available 48-96 hours after online publication and is updated daily on week days.
Initial download of the metrics may take a while.