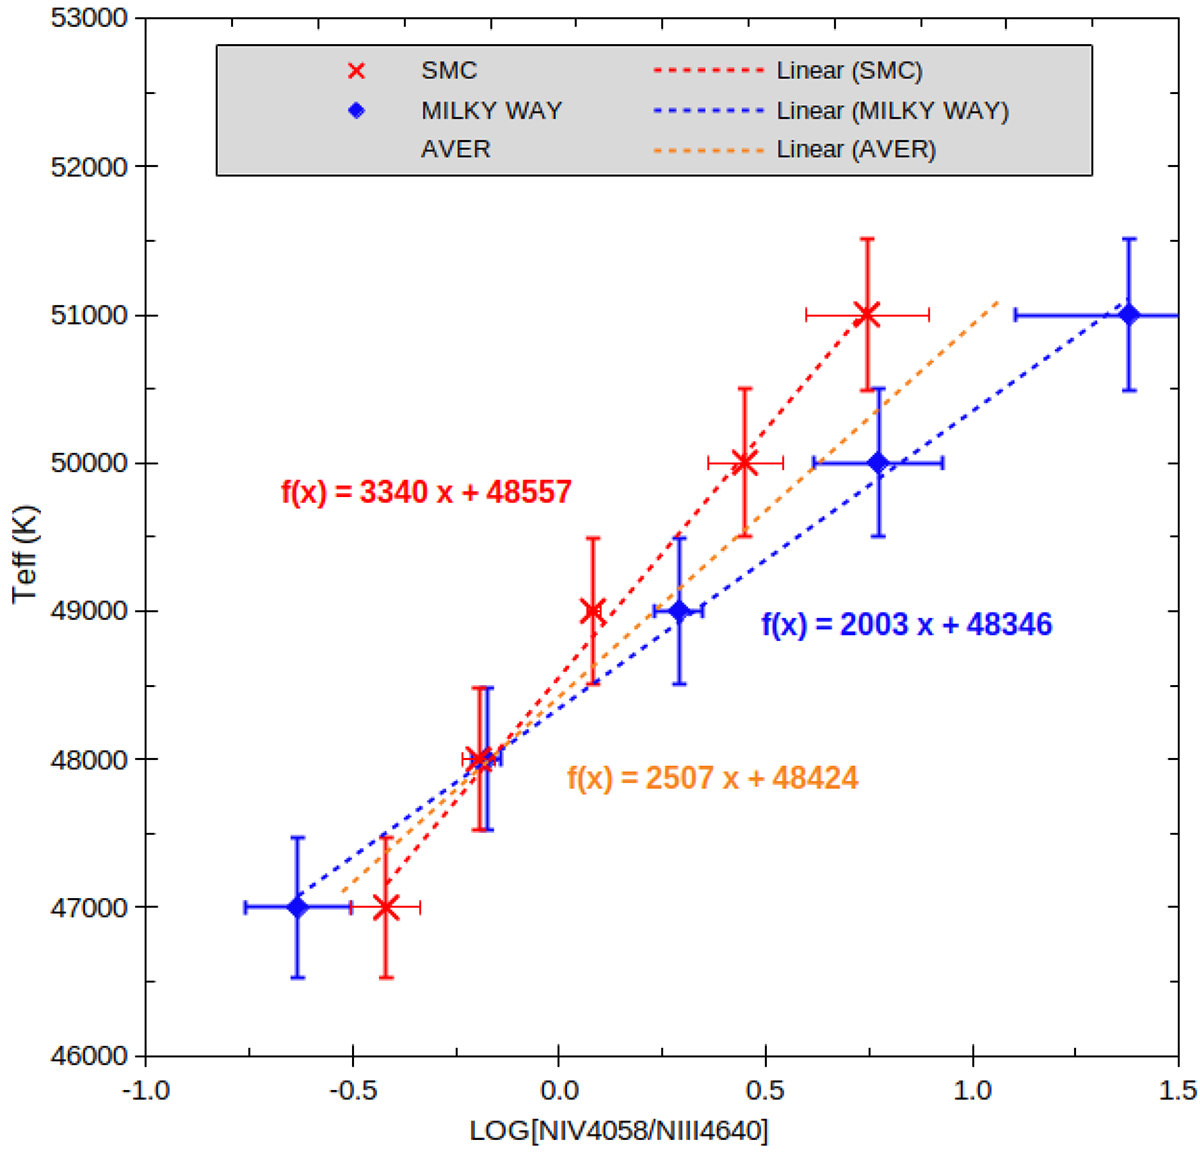
Fig. 3.
Download original image
Log[N IVλ4058/N IIIλ4640] versus effective temperature diagram. The theoretical relations are represented, respectively, by the blue (Milky Way) and red (SMC) symbols. It can be seen that in both cases, there is a linear relation between the effective temperature and the Log[N IVλ4058/N IIIλ4640]. The linear trend appears steeper in the case of the SMC models, so, as consequence, any O2 star should be hotter than its siblings in the Galaxy. One can also see that in the mentioned temperature range, the maximum difference between the effective temperature values of SMC and Milky Way stars (occurring close to the value Log[N IVλ4058/N IIIλ4640] = 1.0) is only ≂1000 K. On the other hand, it can be observed that for a O3 star (Log[N IVλ4058/N IIIλ4640] = 0), both Milky Way and SMC stars should have similar effective temperatures (see text).
Current usage metrics show cumulative count of Article Views (full-text article views including HTML views, PDF and ePub downloads, according to the available data) and Abstracts Views on Vision4Press platform.
Data correspond to usage on the plateform after 2015. The current usage metrics is available 48-96 hours after online publication and is updated daily on week days.
Initial download of the metrics may take a while.