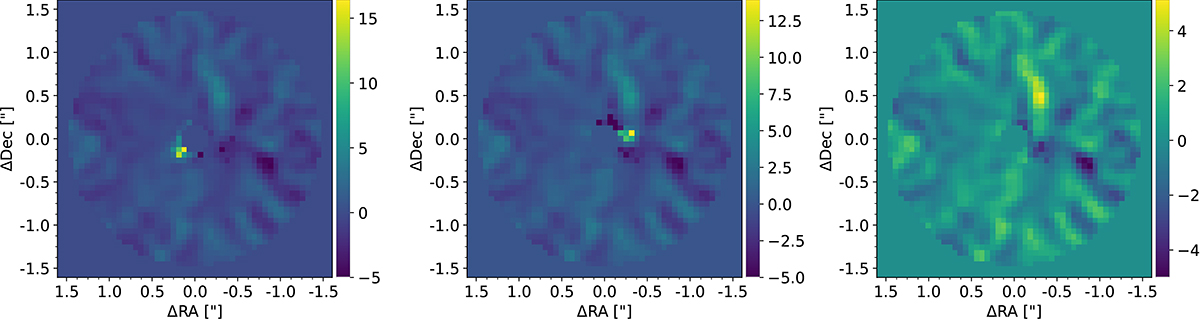
Fig. E.1.
Download original image
S/N maps of the F480M images obtained after roll subtraction and after subtraction of the disk and planets using the optimal parameters found in Appendix B and C. The left (middle) panel shows the S/N map after subtracting the disk and planet c (b) alone, and the right panel shows the S/N map after removing the disk and both planets. Planets b and c and the spiral-like feature are found at S/N values of ∼16.4, ∼13.9, and ∼5.1, respectively. The color bars cover S/N values ranging from -5 up to the maximum S/N value of each respective map.
Current usage metrics show cumulative count of Article Views (full-text article views including HTML views, PDF and ePub downloads, according to the available data) and Abstracts Views on Vision4Press platform.
Data correspond to usage on the plateform after 2015. The current usage metrics is available 48-96 hours after online publication and is updated daily on week days.
Initial download of the metrics may take a while.