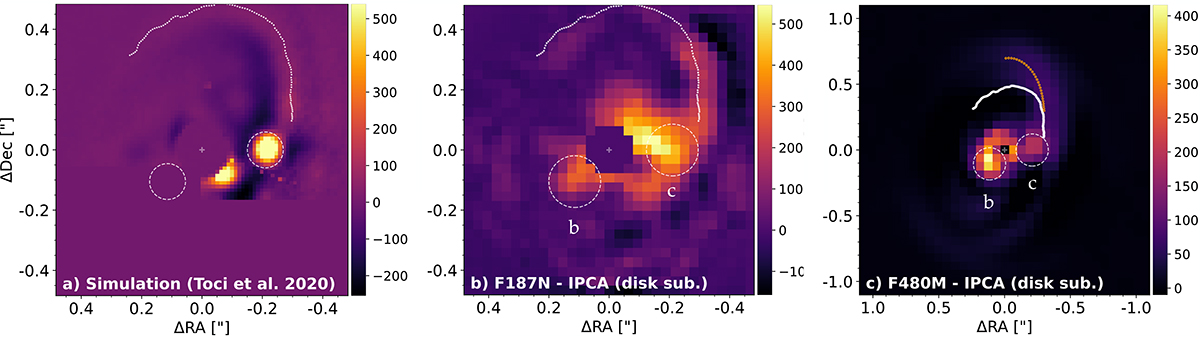
Fig. D.1.
Download original image
Comparison between the hydrodynamical simulation of the system in Toci et al. (2020), who predicted a spiral accretion stream feeding planet c (left), and our observations in the F187N (middle) and F480M (right) filters. The trace of the spiral accretion stream is identified as local radial maxima in the simulation and is shown as white dots in all images. The trace of the outer arm characterized in Juillard et al. (2022) is shown with orange dots. The part of the simulated image that is affected by subtraction artifacts is masked to show the relevant part of the image.
Current usage metrics show cumulative count of Article Views (full-text article views including HTML views, PDF and ePub downloads, according to the available data) and Abstracts Views on Vision4Press platform.
Data correspond to usage on the plateform after 2015. The current usage metrics is available 48-96 hours after online publication and is updated daily on week days.
Initial download of the metrics may take a while.