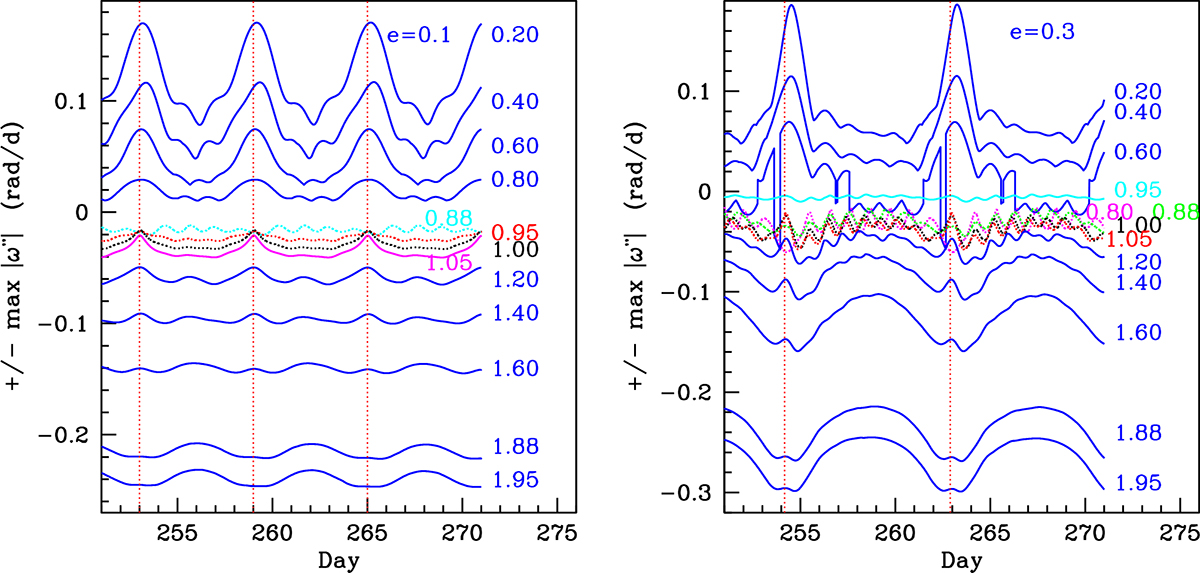
Fig. A.1.
Download original image
Maximum perturbation of the surface angular velocity at the equator plotted as a function of time for e=0.1 (left) and e=0.3 (right). The velocity is measured in the rest reference frame of the rotating star. Positive values indicate motion in the direction of the orbital motion, negative values to motion opposite to the orbital motion. Vertical lines indicate times of periastron. Each curve is labeled with its value of β0. The smallest tidal perturbations for e=0.1 occur for β0=0.88. For e=0.3, the β0=0.80, 0.88, 1.00 and 1.05 curves show low amplitude oscillations and are very similar. The smallest perturbations are observed for β0=0.95. Observational perspective: Surface layer is rotating faster than the inner core for β0< 1 and rotating slower in β0> 1 models. Also, these stars are likely to display variations in the shape of the photospheric line profiles as discussed in Moreno et al. (2005) and Harrington et al. (2009), Harrington et al. (2016). TEOs are evident mostly for β0∼1 models.
Current usage metrics show cumulative count of Article Views (full-text article views including HTML views, PDF and ePub downloads, according to the available data) and Abstracts Views on Vision4Press platform.
Data correspond to usage on the plateform after 2015. The current usage metrics is available 48-96 hours after online publication and is updated daily on week days.
Initial download of the metrics may take a while.