Fig. 8.
Download original image
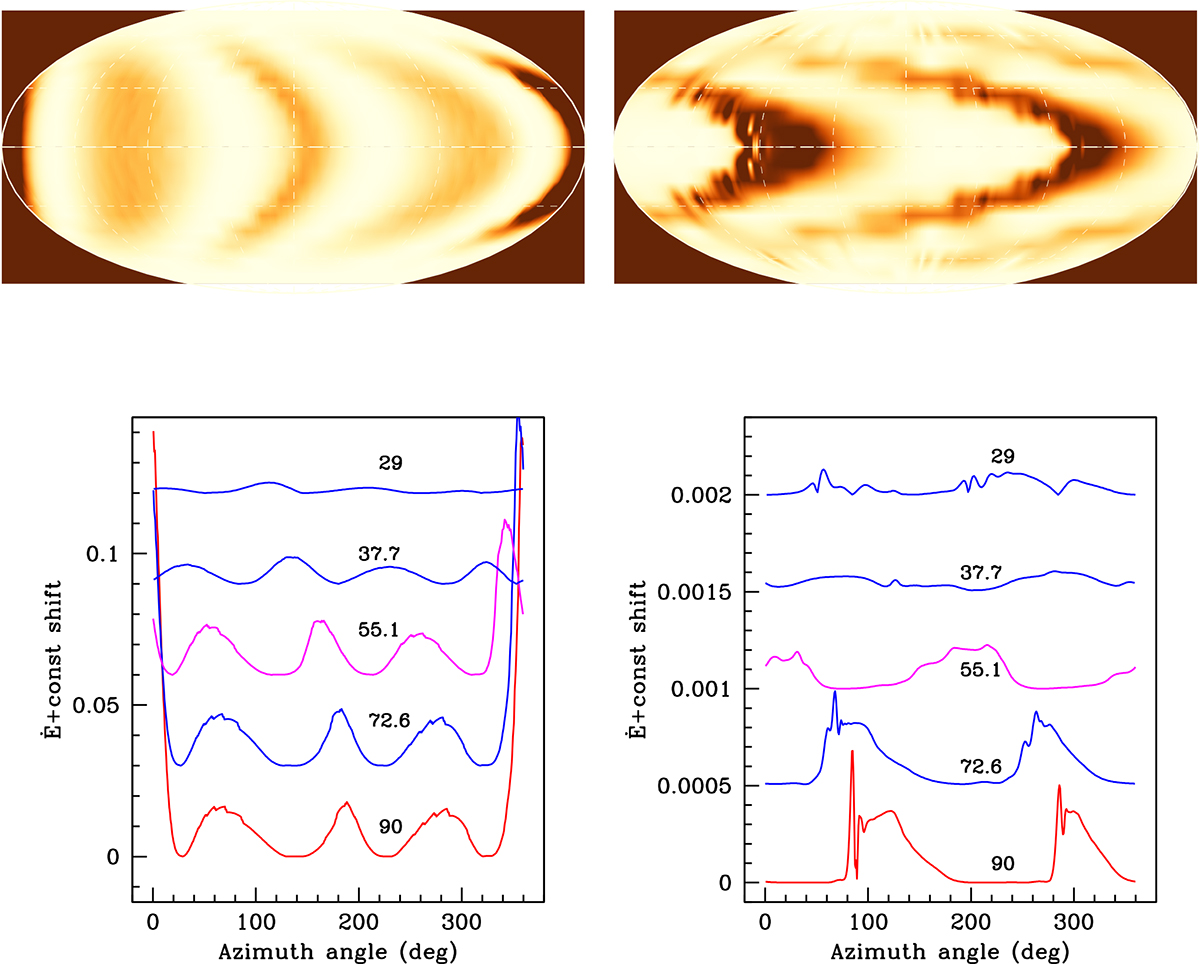
Distribution of the tidal shear energy dissipation in MACHO 80.7443.1718 from the TIDES-nvv model at periastron (left) and apastron (right). Top: maps of the surface, with the sub-binary longitude at φ = 0° and 360° (the rims of the maps), and the poles at the top and bottom. Dark brown represents maximum energy dissipation rate and minimum is color coded white. Bottom: corresponding ![]() per unit volume (in units of 1035 ergs−1 s−1 unit−1 volume) at various latitudes between the equator and the pole. Each curve is labeled with its corresponding colatitude angle. Each latitude is shifted vertically by 0.03 units for display purposes.
per unit volume (in units of 1035 ergs−1 s−1 unit−1 volume) at various latitudes between the equator and the pole. Each curve is labeled with its corresponding colatitude angle. Each latitude is shifted vertically by 0.03 units for display purposes.
Current usage metrics show cumulative count of Article Views (full-text article views including HTML views, PDF and ePub downloads, according to the available data) and Abstracts Views on Vision4Press platform.
Data correspond to usage on the plateform after 2015. The current usage metrics is available 48-96 hours after online publication and is updated daily on week days.
Initial download of the metrics may take a while.