Fig. 3.
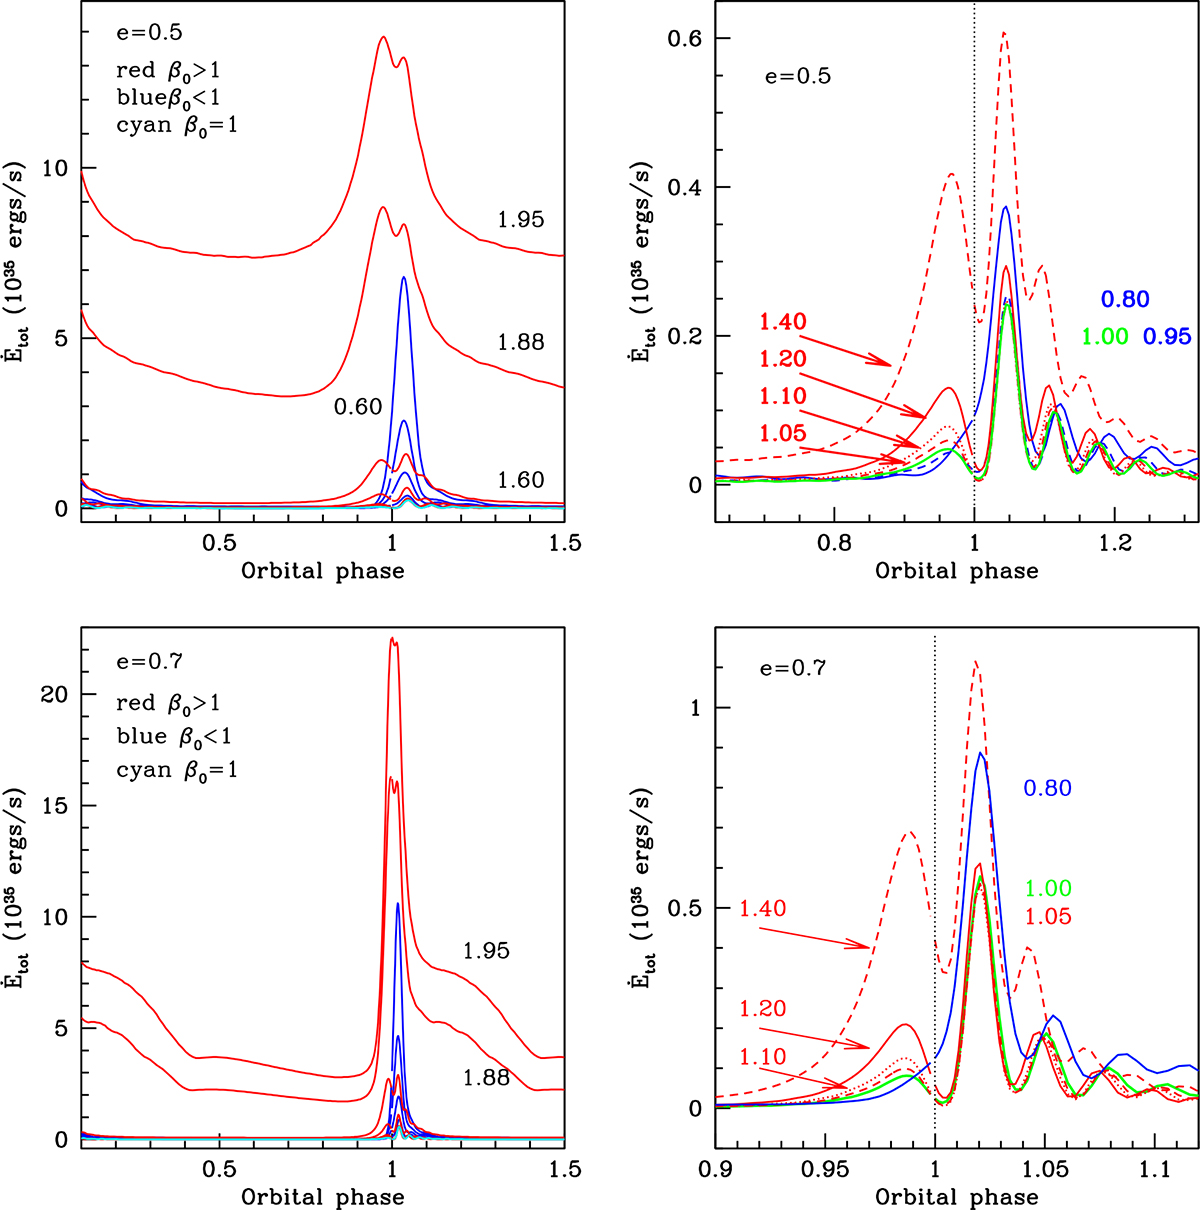
Download original image
Total energy dissipation rate (in units of 1035 ergs s−1) as a function of the orbital phase for the e = 0.5 (top) and e = 0.7 (bottom) models. All β0 values modeled are plotted on the left while on the right we zoom in on the 0.80 ≤ β0 ≤ 1.40 cases. Although the orbital elements are all the same in these models, the perturbation duration around periastron differs, being longer for faster rotation rates (larger β0 values). The lowest-lying curves are those for β0 = 1.00 (green), 1.05 (red dash) and 1.10 (red dot), all of which display several discrete peaks between orbital phase 0.9−1.3.
Current usage metrics show cumulative count of Article Views (full-text article views including HTML views, PDF and ePub downloads, according to the available data) and Abstracts Views on Vision4Press platform.
Data correspond to usage on the plateform after 2015. The current usage metrics is available 48-96 hours after online publication and is updated daily on week days.
Initial download of the metrics may take a while.